


Florida became a housing hot-spot following the COVID-19 pandemic. The shift to remote work drove populations from North to South. Florida's higher rate of retirees in 2020 boosted job growth and the formerly cheap housing market increased relocation appeal across the state. (Not to mention the perks of warmer weather and no income tax.)
The demand for housing has sent house prices and rental rates sky-high. Redfin's April 2022 data for the greatest house price increases include the counties of Lee, Broward, and Miami-Dade, with prices going up between 45-55% compared to the prior year. Rental prices for Florida are no better. Miami is ranked third highest in the country for 1- and 2-bedroom rents as of May 2022, with Fort Lauderdale, Tampa, and St. Petersburg increasing in the total national rankings.
Some reports warn of an impending cool-down, for better or worse.
Dynamic migration data can forecast which areas of Florida may be showing signs of reduced population inflow and also which areas may be ramping up.
Florida still ranks as the number one state for relocation in 2022 according to our recent report, with a total of 147,927 moves between January 2nd and March 12th. Northern states like New York, Michigan, and Ohio are driving these numbers, with Georgia being the only Southern exception in the list of top 5 states with moves to Florida.
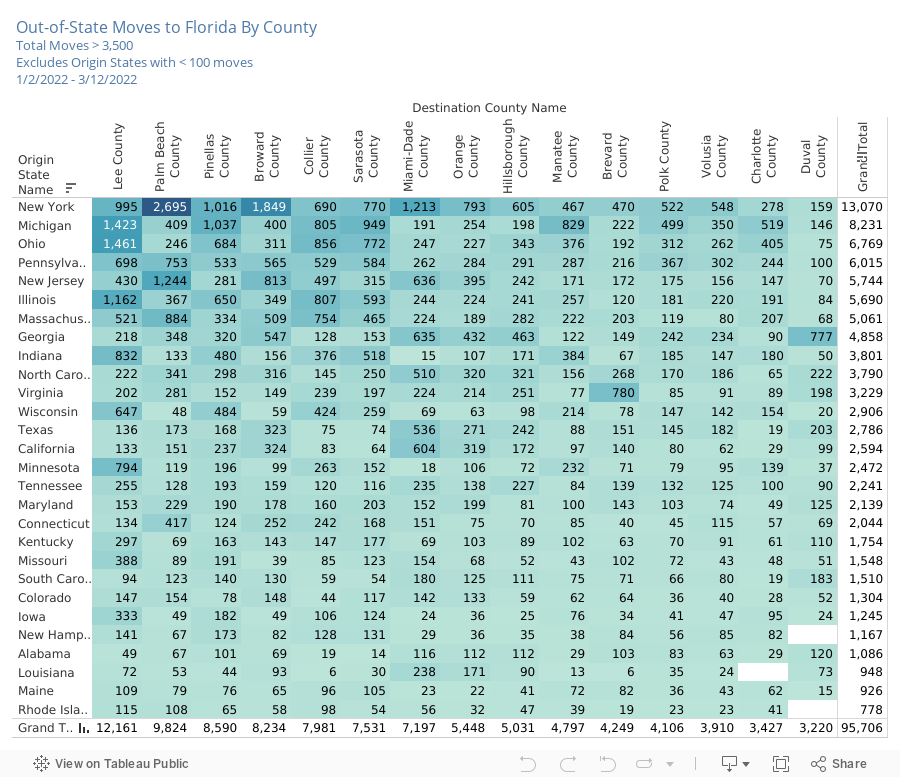
The top 5 Florida counties for relocation in 2022 are:
+ Lee County - 12,161 moves
+ Palm Beach County - 9,824 moves
+ Pinellas County - 8,590 moves
+ Broward County - 8,234 moves
+ Collier County - 7,981 moves
This data tracks with rising house prices, where Lee County accounted for four out of the ten areas where prices rose over 45% since last year. Broward, meanwhile, accounted for three of the ten.
While Palm Beach and Broward Counties saw their largest concentration of moves coming from New York, number one Lee County drew a much more distributed set of new residents from Michigan, Ohio, and Illinois:
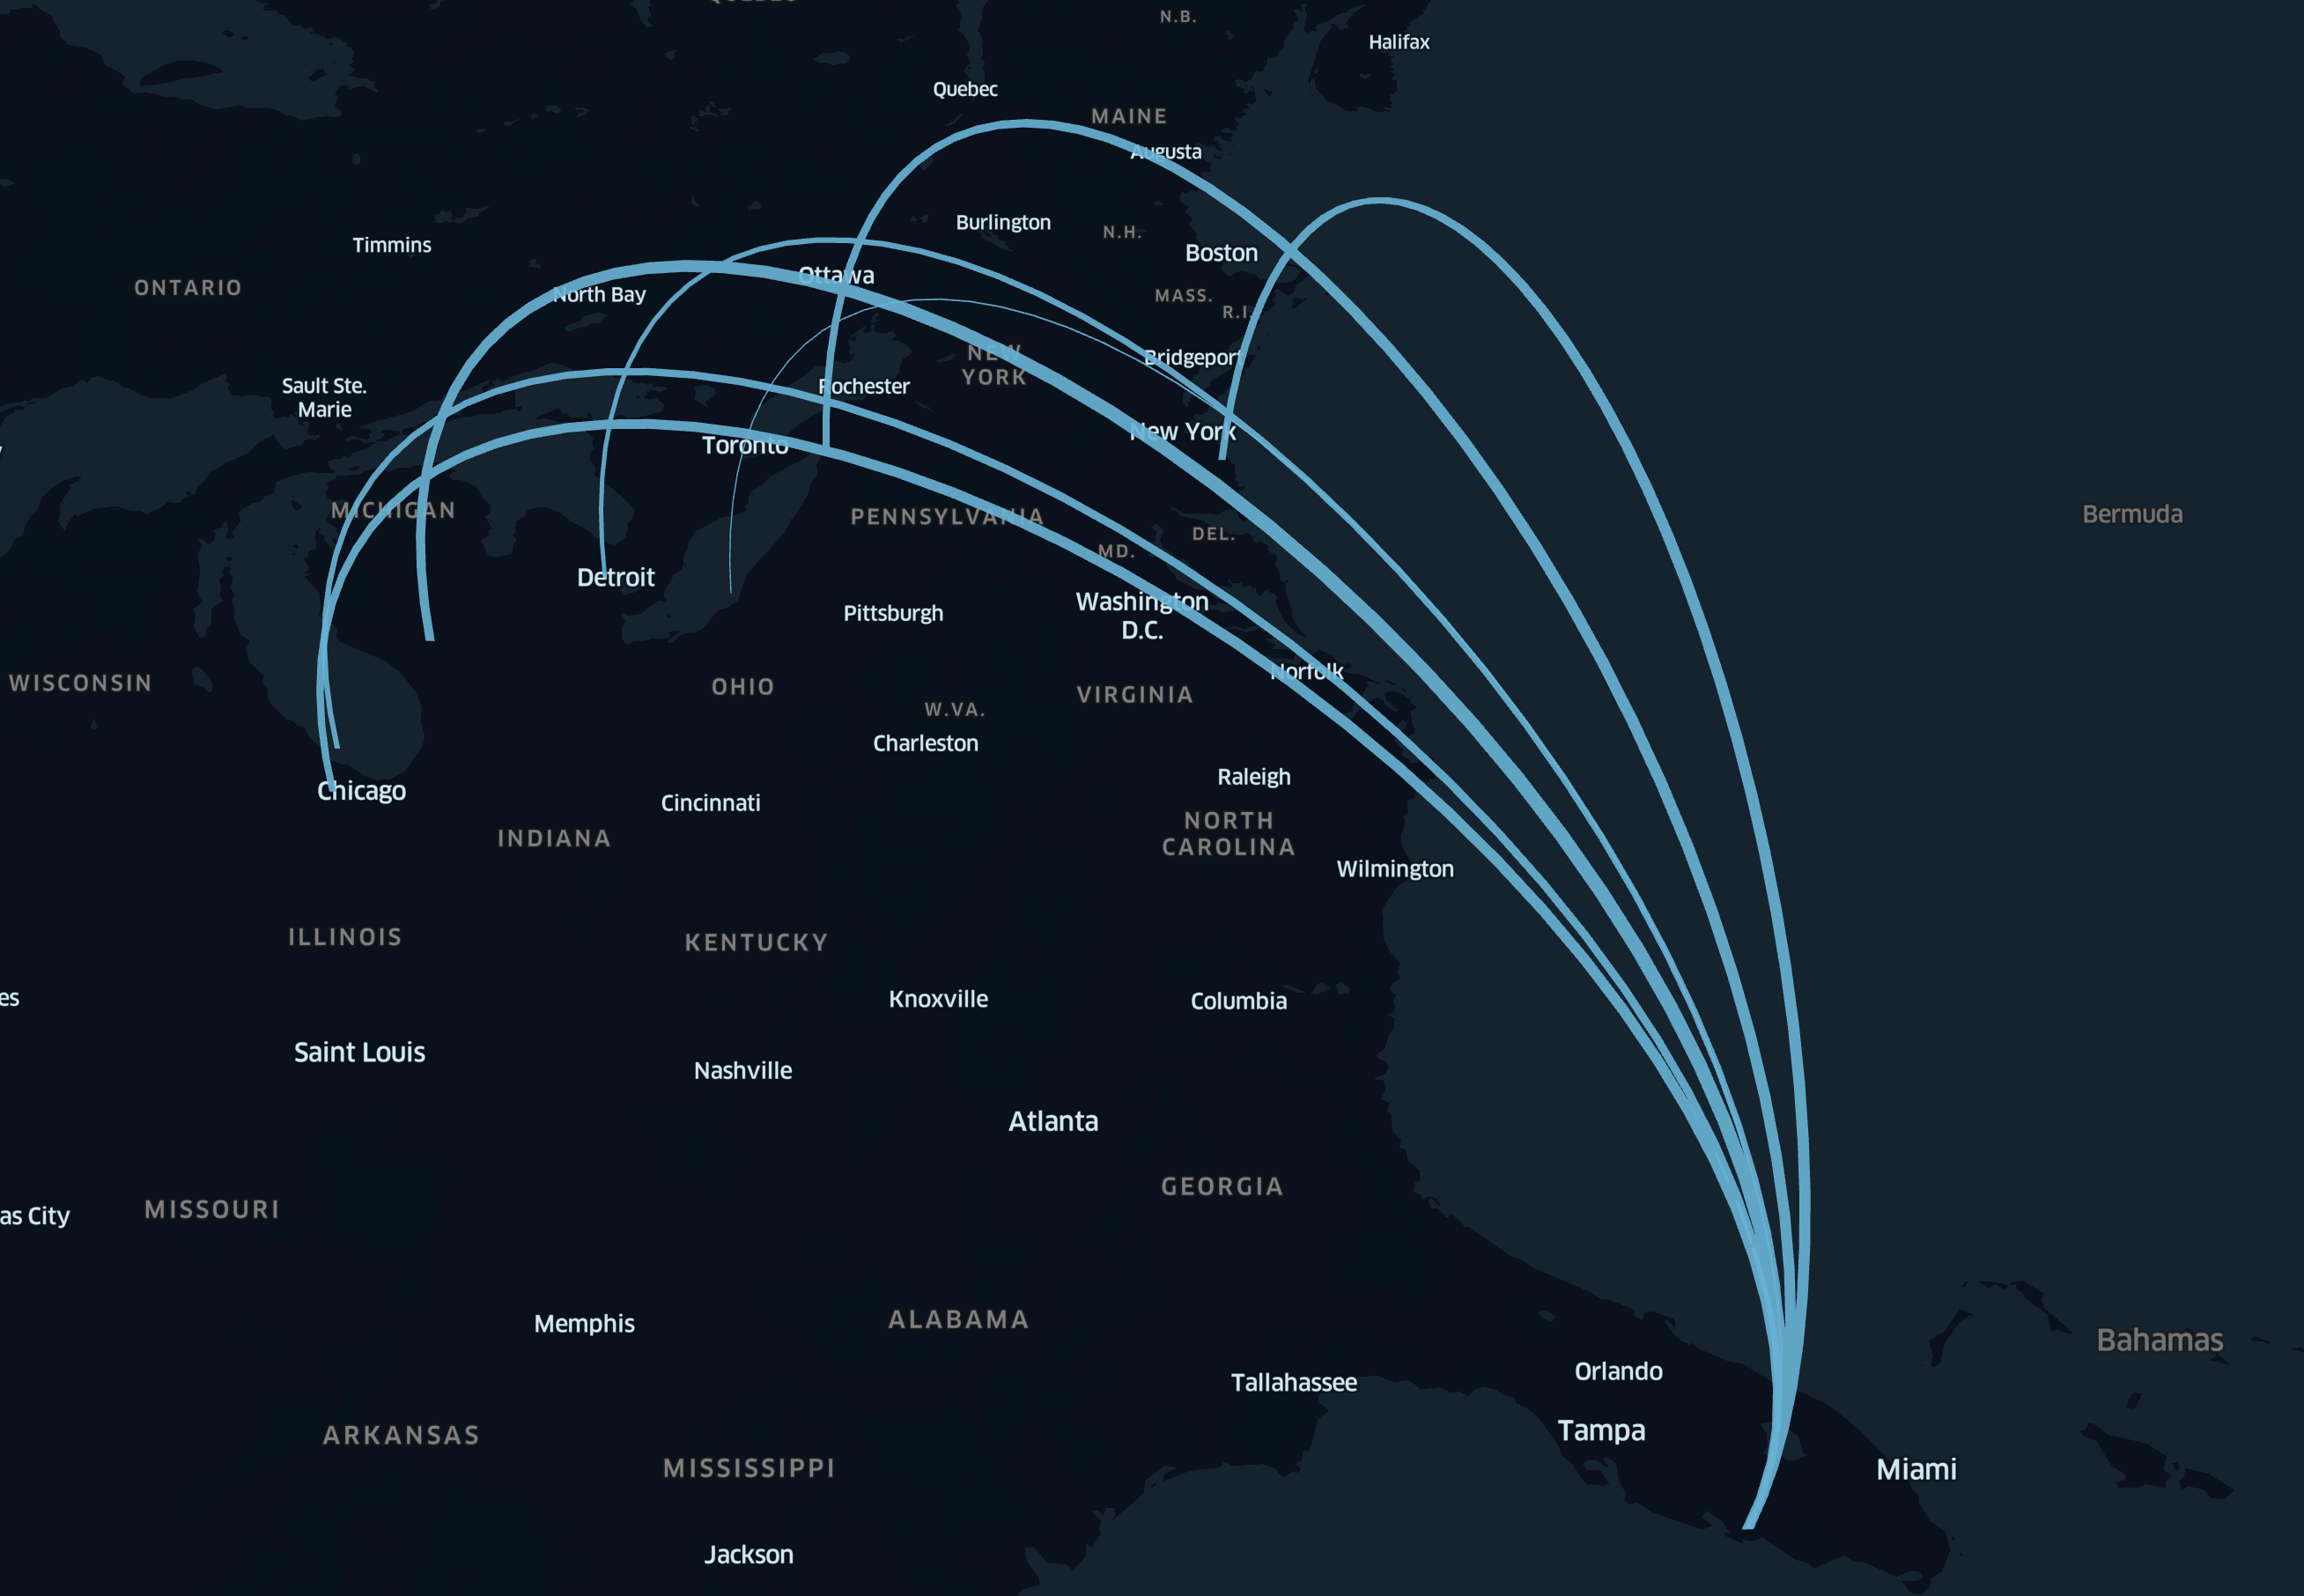
The best way to explain this trend is perhaps the sheer number of beaches in Lee and surrounding counties.
Individuals from colder locales are likely attracted to the enticing tropical landscapes of Florida's Southwest.
Mapping the concentration of moves for January, February, and March 2022 shows regional changes over time. The dark purple clusters along the Southwest coast land right on top of Lee, Charlotte, and DeSoto counties, with Miami-Dade, Broward, and Palm Beach on the East also showing concentrated clusters of migration in January 2022, as seen in the first map depiction below:
.png)
The latter two photos represent February 2022 and the majority of March 2022, with regional changes marked by purple boxes.
Interestingly, February 2022 shows heightened moves in the counties to the east of Lee County, suggesting a possible strain due to housing prices driving new residents inland.
This did ease again in March 2022, and there is sign of a slight cool-down for Lee and Collier counties in this month. Of interest is the higher concentration of moves for Northern counties in the East (Walton and Wakulla counties) and the West (Nassau, Duval, and Clay counties). Will these regions in North Florida become the new hot-spots as incoming residents struggle to find affordable housing? There's also evidence some Floridians are moving up (or back) to New York.
Our numbers indicate overall that out-of-state moves into Florida have indeed slowed in March 2022 compared to overall peaks at the end of January. This is sign the housing market may cool as we head into summer.
However, to fully gauge which counties may be seeing shifts, we examined all moves from out-of-state and within Florida:
In the video, week by week between January 2nd to March 12th, we see a cooling of moves for the Sarasota and Lee county region in the Southwest and in the Palm Beach region in the Southeast.
The Miami market eased slightly in demand but had a much higher concentration of moves compared to other regions, suggesting this market will remain competitive.
Dynamic data is essential for businesses that need to stay on top of how migration will impact demographics, including total income levels, and fluctuations in neighborhood traffic and demand. Demand applies not only to housing, but for business and municipal services too.
State, county, and tract-level migration data is available back to 2019. Neighborhood foot traffic as granular as the census block group level can also be paired with migration data to forecast specific migration impacts on local businesses.
Want a data sample or have questions about migration data? Schedule a meeting to speak with one of our location data experts.


