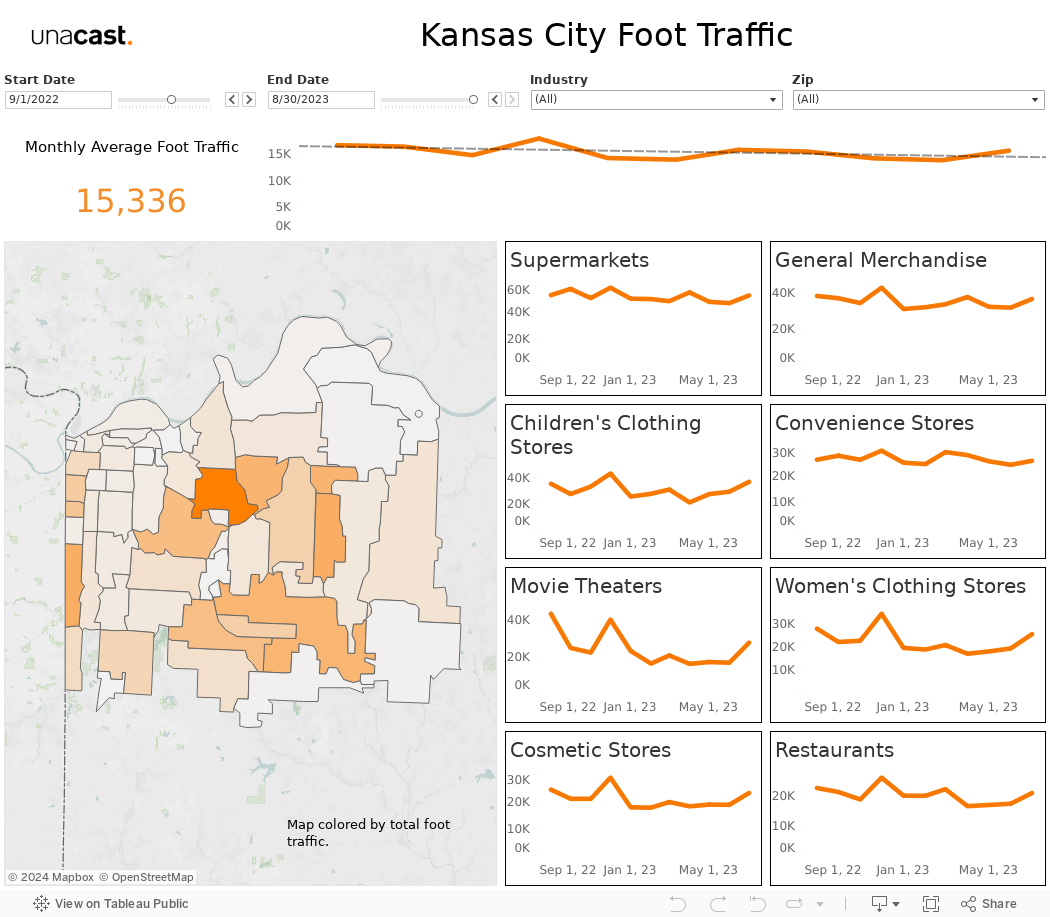
Kansas City Foot Traffic Data Insights by Geography
The average monthly foot traffic per venue for Kansas City in the last 12 months was 15,336, this is a 1.1% increase from the previous 12 months. Though foot traffic in Kansas City is increasing overall, zip code64111 has seen a steady decrease. Independence, Blue Springs and Willow Creek neighborhoods experienced the highest total foot traffic for Kansas City. These 3 neighborhoods constitute over 25% of the total foot traffic experienced from 09/01-2022-08/30/2023. Conversely, the Richards Gebaur, BlueValley, and Fairmount neighborhoods experienced the lowest total foot traffic for the same period of time.
Methodology – Kansas City foot traffic data was pulled from the Foot Traffic Trend Value module on a monthly basis. The metric Person Count was averaged by zip code by month and simple linear regression was applied to generate trend lines for Foot Traffic. When visualizing the data, the total foot traffic by zip code was plotted on a map and colored by total foot traffic. To analyze specific points of interest, data is aggregated at the Census Block Group geographic level. Additionally, Census Track level data can be used to investigate the surrounding area to any point(s) of interest.
Kansas City Foot Traffic Data Insights by Season
Kansas City saw the highest average monthly foot traffic (16,352) April 2022 through December 2022 with June 2023 having the lowest average foot traffic of 13,818 average visitors. December 2022 had the highest average foot traffic (17,904) for the total time frame analyzed (06/01/2021-08/30/2023). When considering only the past 12 months, the foot traffic pattern changes displaying no seasonality. Further analysis would provide insights into this change in visitor behavior.
Methodology - The metric Person Count was summed by zip code by month to generate Foot Traffic. To analyze change in foot traffic by quarter, Person Count was summed by zip code by quarter and the percent change was calculated between quarters.
Kansas City Foot Traffic Data Insights by Industry
Utilizing the North American Industry Classification System (NAICS) codes available in the foot traffic trend value module, consumers can gain valuable insights on 93 unique industry sectors found in Kansas City.The top industries include: Supermarkets, General Merchandise Stores, Children’s Clothing Stores,Convenience Stores, and Movie Theaters. While the industry specific foot traffic patterns generally mirror the overall foot traffic pattern of Kansas City, there is a notable difference in the general merchandise industry. While the foot traffic trend in Kansas City is increasing, the general merchandise industry is experiencing an decrease in average monthly foot traffic. Additionally, there was a larger than expected increase in foot traffic in the general merchandise industry in April 2023. Deeper analysis of foot traffic data for specific brands in the general merchandise industry could illuminate potential causes for this uptick.
Methodology – The NAICS codes were grouped to create broader Industry level classifications. The Person Count metric was then averaged by industry by month to calculate foot traffic. The data was then visualized for individual industries.
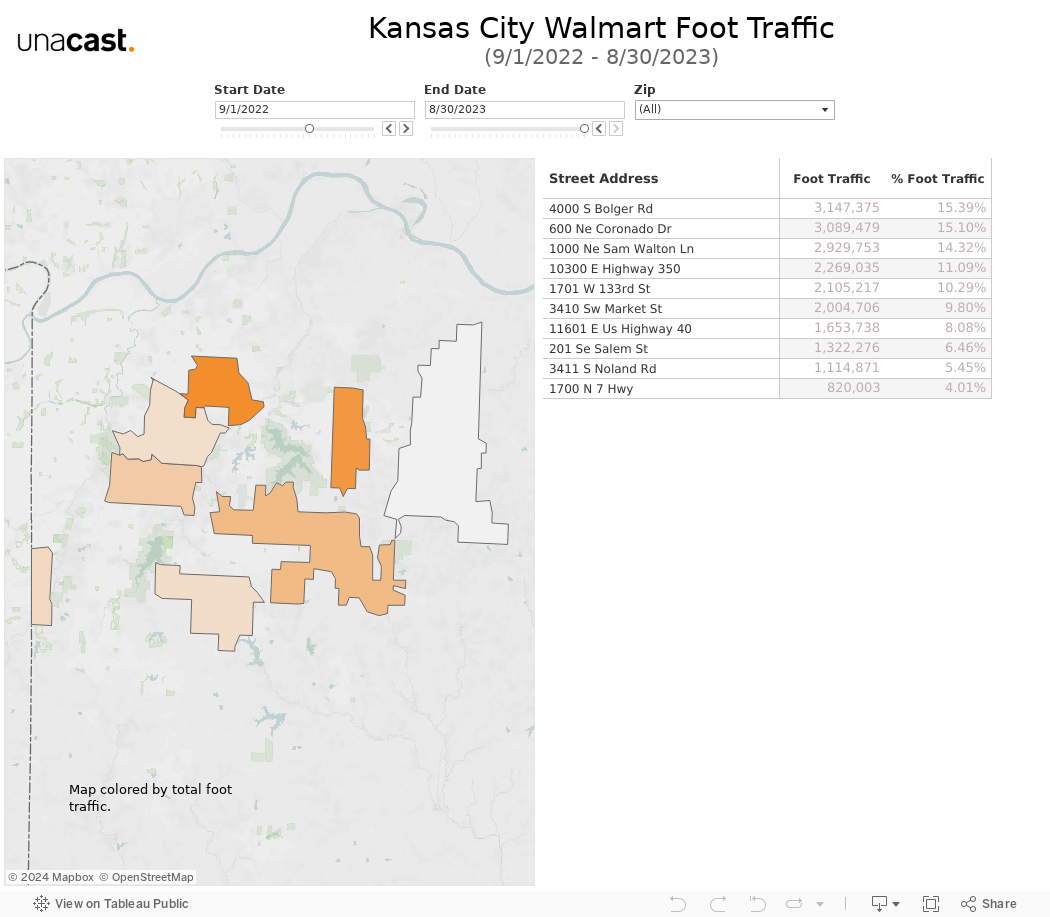
Kansas City Foot Traffic Data Insights by Brand
Foot Traffic data is available for 689 unique brands in Kansas City allowing consumers to create detailed brand analysis as well as head-to-head comparisons between two or more brands. The most highly trafficked brands in Kansas City include: McDonald’s, Walmart, Sonic, Target, and Starbucks.Taking a deeper dive into the foot traffic data available for the 10 Walmart locations in Kansas City, we find that 100% or 10 locations are experiencing an decrease in foot traffic. For the time period 09/01/2022-08/30/2023, Independence has the highest average foot traffic pattern with 286,125 visits per month. The Independence area had the highest total foot traffic for Kansas City Walmart locations with4,262,246 visits. This can be explained by the zip code 64055 being home to 2 Walmart locations in total. The total foot traffic at the 4000 S Bolger Rd location is decreasing, it is the most visited Walmart boasting approximately 15.4% of all Walmart foot traffic in Kansas City. Conversely, the 1700 N 7 Hwy location accounts for only 4.01% of the total Kansas City Walmart foot traffic.
Methodology – The Kansas City data was filtered to only consider the brand Walmart. The metric Person Count was summed by zip code by month to calculate Foot Traffic. To analyze change in Foot Traffic by quarter, Person Count was summed by zip code by quarter and the percent change was calculated between quarters. For location level data, Person Count was summed by Street Address. Foot Traffic Percentage was calculated by taking the sum of foot traffic for street address and dividing the resulting value by the total FootTraffic for Kansas City in the selected date range.