What is Location Data? The Complete Guide for Data and Product Teams
Location data, also known as geospatial data, refers to objects present in a geographic space.

Location data, also known as geospatial data, refers to objects present in a geographic space.
Welcome to Unacast’s Location Data Knowledge Base. This free library is collected from resources around the web and compiled for easy use. Use this page to get acquainted with the basics. The links and side navigation will help you to drill down on different location data types, examples, providers, and use cases.
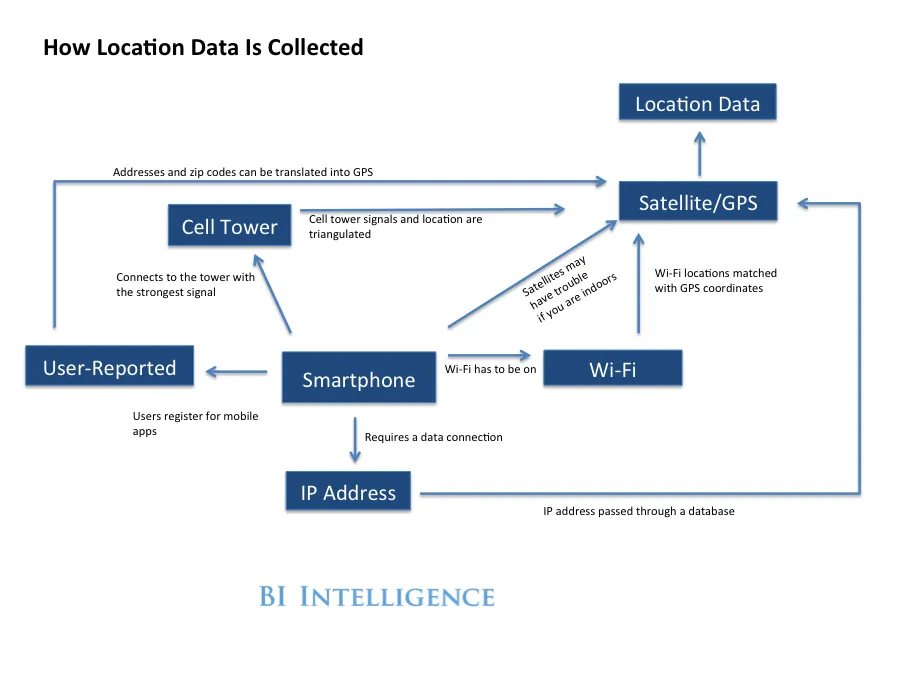
Location data is the digital footprint produced by the movements of people and things in the physical world. While basic location information can be gathered via IP address from devices, the most valuable and precise location data comes from GPS signals collected from mobile devices. For enterprise applications, this data must be collected with explicit opt-in consent, properly processed to remove noise and duplicates, and aggregated to protect individual privacy.
More than just a series of coordinates and timestamps, location data represents human mobility patterns that can power sophisticated applications across industries. The raw signals capture where devices have been, when they were there, and how they moved between locations, creating a rich dataset for understanding real-world behavior.
Location data commonly originates from mobile phones, tablets, connected vehicles, IoT sensors, and other GPS-enabled devices. The most reliable sources include mobile applications that have legitimate business reasons to collect location information, such as weather apps, navigation services, and delivery platforms.
The collection process involves software development kits (SDKs) embedded in mobile applications that capture GPS coordinates, cellular tower information, and Wi-Fi network data. These signals are then transmitted to data aggregators or directly to location data providers, where they are repackaged into specific products or resold at scale.
For technical teams, it's important to understand that raw location signals require significant processing before they're suitable for enterprise applications. This includes removing duplicate signals from multiple sources, validating movement patterns for authenticity, and filtering out synthetic or replay data, which can comprise up to 50% of some datasets.
Location data is typically processed and delivered at two distinct levels of granularity, each serving different use cases and privacy requirements.
Device-level location data maintains mobile advertising IDs (MAIDs) or other pseudonymous identifiers while keeping individual movement patterns intact. This granular data enables precise targeting and attribution capabilities but requires careful attention to privacy and compliance with data protection regulations.
At this level, data teams can track individual device journeys, understand specific visitation patterns, and build detailed behavioral profiles. The mobile IDs remain anonymized, meaning they cannot be directly linked to personally identifiable information, but they maintain consistency across time periods for analysis purposes.
This granularity is essential for applications like audience segmentation in digital advertising, where understanding individual behavior patterns enables more precise targeting and measurement.
Aggregated location data combines individual signals into statistical summaries that protect privacy while enabling population-level analysis. This approach is ideal for understanding broader trends like foot traffic patterns, migration flows, and market dynamics without exposing individual behavior.
Modern aggregation processes increasingly rely on machine learning algorithms to identify optimal grouping strategies and detect meaningful patterns in population-level data. Because machine learning can take into account circumstances that dramatically influence foot traffic, such as weather, special events, etc., machine learning models can help understand larger patterns despite location data signals picking up only a fraction of the population. Thus, these techniques can help predict seasonal variations in foot traffic, and uncover hidden correlations between different location types and demographic segments.
Get an edge on your competition with Unacast’s location data sets.
For data teams building advertising platforms, device-level location data enables the creation of highly targeted audience segments based on real-world behavior. Teams can identify users who have visited specific locations, frequent certain types of venues, or exhibit other mobility patterns.
The technical challenge involves processing millions of location signals to identify meaningful visitation patterns while maintaining data quality and privacy compliance. Advanced clustering algorithms help identify venues of interest, while statistical modeling accounts for sampling bias and data completeness.
Identity resolution becomes crucial at this level, as teams work to connect location behavior with other consumer data sources to create comprehensive user profiles for targeting and personalization.
Device-level data powers digital out-of-home (DOOH) advertising by enabling precise measurement of ad exposure and subsequent behavior. Data engineers can create geofences around billboard locations and track which devices were exposed to advertisements, then measure downstream actions like store visits or website engagement.
This application requires high spatial accuracy and processing capabilities to match device locations with advertising inventory. The technical infrastructure must handle streaming location data and perform rapid spatial queries to determine ad exposure.
Location data serves as a powerful signal for identity resolution, helping data teams connect mobile advertising IDs with other identifiers like hashed email addresses (HEMs), frequently leverage IP addresses (FLIPs), and other identifiers from online resources.
Through sophisticated cross-device linkage technology that leverages both deterministic and probabilistic signals, advertisers can achieve more accurate cross-device tracking and comprehensive audience identity resolution.
Modern data solutions adhere to the latest privacy regulations, ensuring that identity data is ethically sourced and compliant with industry standards through privacy-first data processing approaches. Enhanced identity graphs expand and refine data linkages, allowing advertisers to reach audiences more effectively without sacrificing accuracy, while specialized providers work directly with partners to help them build stronger, more comprehensive identity graph solutions.
Device-level location data helps supply chain teams understand real-world movement patterns for inventory optimization and logistics planning. By analyzing historical and current location data, businesses can identify patterns and trends that inform future operations, with predictive analytics forecasting demand fluctuations and allowing companies to adjust inventory levels proactively.
Location intelligence provides greater insight into consumer behavior and demand patterns, enabling businesses to understand where consumers go in the real world and adjust inventory accordingly. Ultimately, location data transforms supply chain management by enabling enhanced visibility and responsiveness, allowing organizations to monitor shipments, optimize routes, and predict delays for proactive adjustments during disruptions.
Aggregated location data enables population-level analysis and trend identification while maintaining strong privacy protections through statistical aggregation.
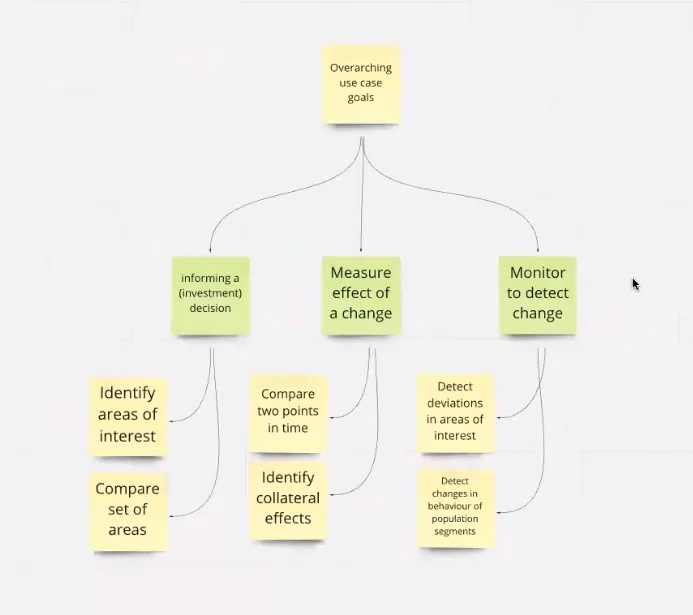
Aggregated location data excels at identifying and quantifying changes in human mobility patterns over time. During major events like the COVID-19 pandemic, aggregated data revealed urban exodus patterns, changes in retail foot traffic, and shifts in commuting behavior that informed business and policy decisions.
Data teams use this information to build predictive models for market changes, identify emerging trends before they become apparent through traditional metrics, and validate assumptions about customer behavior changes.
Real estate investors, retail chains, and financial institutions use aggregated location data to inform investment and expansion decisions. The data provides objective metrics about foot traffic trends, demographic shifts, and competitive dynamics in potential investment areas.
For example, retail chains analyze foot traffic patterns at competitor locations to identify underserved markets or evaluate potential store locations. Real estate investment teams use migration pattern data to identify emerging growth areas before they become obvious through traditional economic indicators.
Learn how to leverage custom location data sets to power best-in-class decision making!
Aggregated location data enables sophisticated competitive analysis without revealing individual customer information. Retail chains can compare their foot traffic performance against competitors, identify market share trends, and understand seasonal variations in competitive dynamics.
The analysis typically involves creating matched sets of similar venues and comparing performance metrics over time. Statistical techniques help account for factors like location quality, market size, and seasonal variations to provide accurate competitive benchmarks.
Marketing teams use aggregated location data to understand market penetration, identify target demographics, and optimize marketing spend allocation. The data reveals which geographic areas have the highest concentration of target customers and how those patterns change over time.
This application often involves combining location data with demographic and psychographic data to create comprehensive market profiles. The resulting insights inform media planning, store marketing strategies, and expansion prioritization.
Processing location data at enterprise scale presents unique technical and operational challenges that traditional data pipelines aren't designed to handle.
Quality location data is rich in both the temporal and spatial sense. That is, it provides accurate detail of both time and place, and it can be combined with other data and aggregated at-scale.
One of the most significant challenges facing data teams is ensuring location data quality across multiple sources. Industry research indicates that up to 50% of location signals from some providers may be synthetic, replayed, or otherwise unreliable, requiring sophisticated validation processes.
Common quality issues include replay data (old signals with altered timestamps), synthetic signals generated by bots or emulators, device spoofing, and implausable movement patterns. Identifying these issues requires advanced pattern recognition and validation.
Most enterprise teams work with multiple location data providers to achieve necessary scale and coverage. This creates significant engineering challenges around schema standardization, expensive storage of duplicative signals, and quality normalization between providers with different collection methodologies. Each provider typically delivers data in different formats, with varying update frequencies and quality standards.
Location data processing must comply with an evolving landscape of privacy regulations including GDPR, CCPA, and industry-specific requirements. This involves implementing privacy-by-design architectures, managing user consent and opt-out requests, and removing signals from sensitive locations.
The technical implementation requires building systems that can handle privacy controls at scale, maintain audit trails for compliance reporting, and adapt to changing regulatory requirements without disrupting production systems.
Enterprise location data processing involves sophisticated pipelines designed to handle the unique challenges of spatial-temporal data at massive scale.
The processing pipeline begins with signal collection from multiple sources, including first-party mobile applications, third-party data aggregators, and direct partnerships with app publishers. Each source provides different data formats, update frequencies, and quality characteristics that must be normalized during ingestion.
Modern processing systems use streaming architectures that can handle real-time data ingestion while performing initial validation and quality checks. This includes basic format validation, timestamp verification, and preliminary duplicate detection to filter out obviously problematic signals before they enter the main processing pipeline.
Find out why best in class companies partner with Unacast for their location data needs.
One of the most complex aspects of location data processing involves identifying and merging duplicate signals from multiple sources. The same device location may be reported by multiple data providers, creating redundancy that inflates storage costs and skews analysis results.
Advanced deduplication systems use spatial-temporal clustering to identify signals that represent the same real-world event, then apply sophisticated merging algorithms to create single, high-quality records. This process can reduce raw signal volumes by 30-40%, which reduces storage costs.
Enterprise-grade location data processing includes comprehensive quality validation that goes beyond basic format checking. This involves analyzing movement patterns for realistic behavior, validating device identifiers for authenticity, and identifying synthetic or manipulated data.
Forensic analysis techniques include UUID version validation, temporal consistency checking across signal sequences, and cross-provider validation to identify suspicious patterns. These processes help ensure that downstream applications receive reliable, authentic location data.
All location data processing must include robust privacy controls, including sensitive location filtering. This requires maintaining comprehensive databases of sensitive locations to ensure these signals are not available on the market.
Let the experts at Unacast help you leverage your valuable data with the Turbine first party data platform.
For organizations building location-powered products or analytics, a critical decision emerges: build your own location data infrastructure or partner with a specialized provider. Building enterprise-grade data infrastructure for location intelligence requires massive upfront investment, with costs including volume overload handling, data quality variability management, infrastructure complexity for geospatial data, and compliance with privacy risks.
Modern data infrastructure requires comprehensive end-to-end solutions spanning data collection, storage, processing, and analysis, with organizations increasingly seeking fewer yet better products to address these challenges. Most companies find that developing location data processing capabilities in-house is impractical, requiring specialized technical expertise, significant ongoing investment, and regulatory compliance knowledge that diverts resources from core product development.
Unacast addresses these challenges by providing enterprise-grade location intelligence infrastructure that eliminates the need for organizations to build and maintain complex data processing systems. Rather than simply selling raw location data, Unacast invests millions annually in data acquisition and processing infrastructure, creating a comprehensive platform that transforms billions of daily signals into production-ready location intelligence.The platform maintains resilience through partnerships with over a dozen continuously vetted data sources, ensuring supply chain stability while processing over 60 billion location signals daily through proprietary systems. This multi-source approach minimizes the risks associated with single-provider dependencies while delivering the scale and coverage required for enterprise applications.
• Signal merging technology that consolidates spatially and temporally similar signals without losing valuable metadata
• Forensic analysis capabilities that identify anomalous data patterns and synthetic signals
• Privacy-first processing that ensures compliance with sensitive location restrictions and regulatory requirements
• Flexible integration options that work with existing data stacks and workflows
By partnering with Unacast, organizations can focus engineering resources on differentiated product features rather than data infrastructure challenges. This approach provides four key benefits: avoiding massive infrastructure costs, reducing engineering overhead so data science teams can focus on insights rather than cleaning raw data, ensuring reliable high-quality data through professional vetting and enrichment, and staying compliant with evolving privacy laws.
The platform supports the entire product lifecycle through APIs for on-demand access, batch delivery for data lake integration, and enriched datasets that can be used directly in applications. This comprehensive approach enables organizations to accelerate time-to-market while maintaining the data quality and compliance standards required for enterprise applications.
For companies building audience targeting platforms, retail analytics tools, or real-world measurement solutions, Unacast provides the foundational infrastructure that enables innovation without the operational complexity of managing location data processing at scale.
Unacast is the enterprise location intelligence partner trusted by leading companies for audience targeting, retail analytics, and real-world measurement. Our platform processes 60+ billion daily signals from 15+ providers, delivering clean, reliable, and privacy-compliant location insights at unprecedented scale.
We specialize in solving the complex technical challenges that data teams face when working with location data, from multi-provider integration and quality validation to privacy compliance and real-time processing. Our clients leverage our products to enhance their decision making and strategies around competitive intelligence, investment decisions, forecasting, and market analysis.
Find out why best-in-class companies partner with Unacast for their location data needs.
Discover how analyzing real-world movement patterns can reveal valuable trends in customer behavior, optimize business operations, and enhance strategic decision-making.
An individual's location data can be extracted from their mobile devices by many of the apps they use daily. We understand that the privacy of personal data is incredibly influential on consumers' purchasing decisions.
Unacast passionately believes every consumer deserves the right to maintain control over how their data is captured, stored and used. That's what we consider privacy-friendly data-information obtained with explicit consent from its owner. Just as experts predicted, consumers will always favor privacy-friendly companies with transparent data privacy policies.
We gather data from millions of smart phones across the United States and beyond. We never collect or store any personal data without your explicit, opt-in consent. This ensures the confidentiality of user identity and personal information at all times.
