


In our latest data exploration, we decided to study foot traffic in some of America’s largest metropolitan cities. Through exploring city foot traffic we’re able to understand the patterns of human movement in these communities today. What types of places do they visit? When do they visit, and how far do they travel? And, what do their foot traffic patterns say about the priorities of each city's residents?
Since 2020, consumer behavior has undergone several transformations, pivoting towards online shopping, working from home, and fewer physical interactions in public spaces. These behavioral shifts are largely attributed to the global pandemic, which has fast-tracked changes in how people live, work, and engage with their communities.
By analyzing location data derived from consumer mobile devices, businesses, urban planners, and policymakers in these cities can gain data-driven insights to adapt to the new normal, ensure economic recovery, and reinvigorate public spaces in ways that align with changing consumer behavior in the years ahead.
Exploring City Foot Traffic Data In Detail
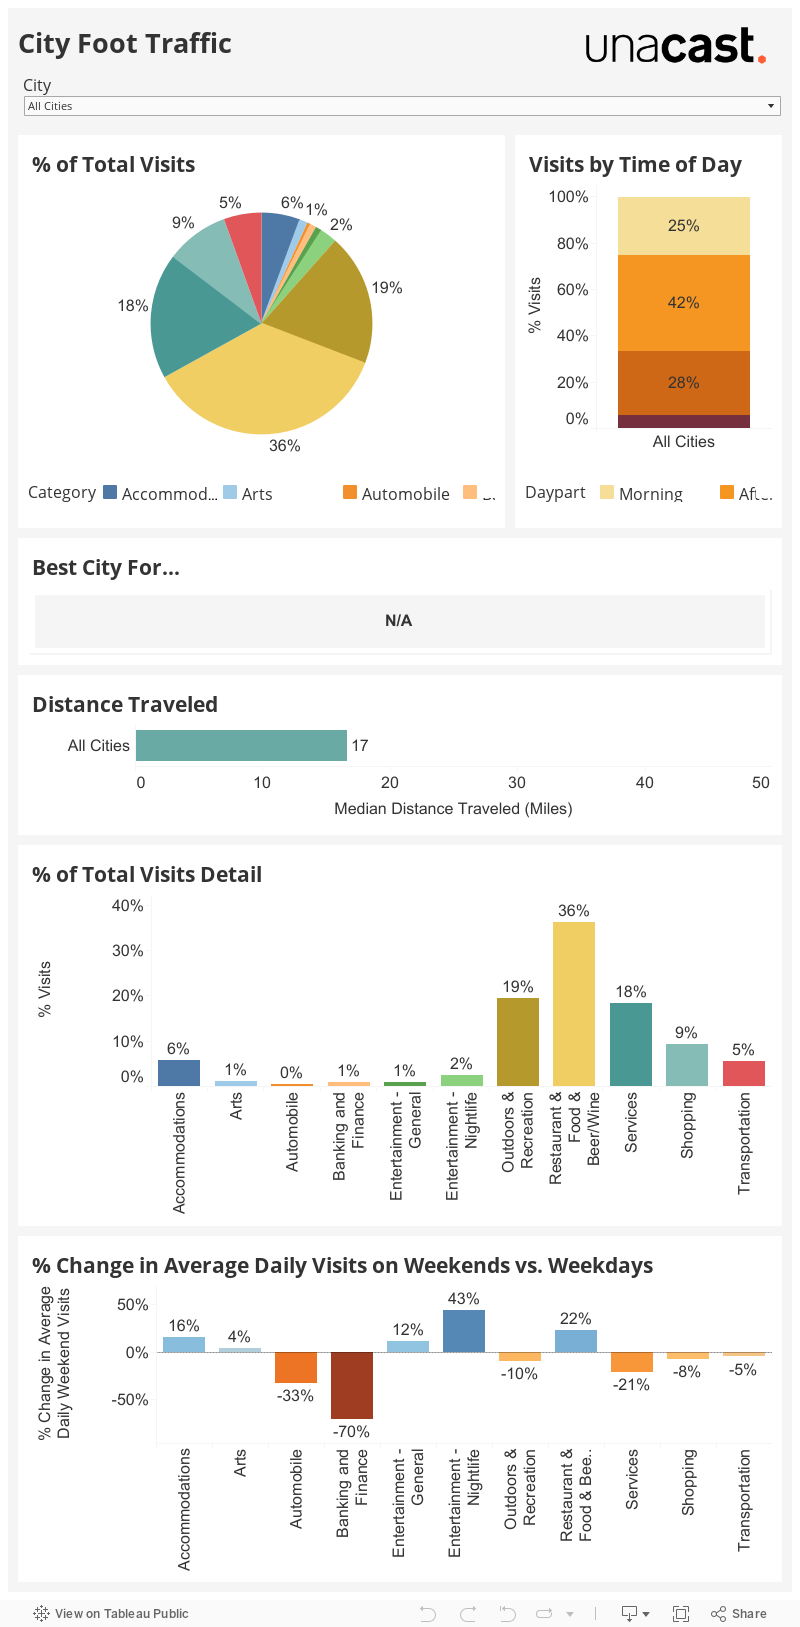
Unacast's City Foot Traffic dashboard shows the distribution of visits across various place categories in 25 diverse U.S. cities during 2023. This interactive dashboard aggregates and visualizes Unacast's foot traffic data, revealing trends in public engagement with spaces including accommodations, retail shopping centers, and restaurants. By calculating the share of visits in each category, stakeholders—including city planners, business owners, and policymakers—can infer patterns of urban movement and interest and, in turn, inform decisions on infrastructure development, public health directives, and commercial investments.
The City Foot Traffic dashboard further enhances our understanding of city dynamics by including key metrics such as the average distance traveled by visitors to different places, and the distribution of visits by time of day. These metrics provide deeper insights into the behavioral patterns of each city's residents and visitors. For instance, by analyzing the average distance traveled, stakeholders can determine the catchment area of various facilities and amenities, aiding in strategic planning and resource allocation. Additionally, the breakdown of visits by time of day sheds light on peak activity periods, allowing for better management of public spaces and transportation services to accommodate these fluctuations in demand.
City Foot Traffic Patterns Reveal Consumer Preferences
The City Foot Traffic dashboard also explores changes to visitation patterns on weekends compared to weekdays, adding perspective to the ebb and flow of city life. This analysis highlights the shift in urban dynamics, where certain categories of places see increased foot traffic on weekends due to leisure and social activities, while others see far fewer visits as business districts quiet down. By distinguishing between these patterns, the dashboard offers a nuanced view of urban behavior, enabling city planners and businesses to tailor their strategies and services for maximum impact. Whether it's extending hours at cultural hotspots or improving weekend transit options, understanding these shifts ensures that cities remain vibrant and accessible for all.
Finally, we analyzed the behavior of devices residing in each city to determine what personas are most prevalent in each city. This approach allowed us to segment the population based on their activity patterns, revealing valuable insights into the lifestyle and preferences of the city's inhabitants. For instance, in cities with a high volume of visits to parks and outdoor recreational facilities, an "Outdoor Enthusiast" persona might dominate. Conversely, in cities where retail and dining establishments see more foot traffic, a "Mall Lover & Frequent Shopper" or "Foodie" persona might be more prevalent. By understanding these personas, businesses and city planners can tailor services, inventory, and advertising strategies to align with the interests and needs of city residents. This targeted approach not only enhances the relevance of services and products offered but also improves ad targeting and campaign ROI, creating a more dynamic and responsive urban ecosystem.
The Role of Visualizations in Foot Traffic Data Analysis
Visualizations play a crucial role in data exploration, transforming large and complex datasets into intuitive and accessible insights. By using visual representations such as charts, graphs, and maps, data visualization allows for a more immediate comprehension of trends, patterns, and outliers. This not only accelerates the decision-making process but also democratizes data access, enabling stakeholders at all levels of data literacy to engage in informed discussions. Furthermore, visualizations make it possible to identify relationships and correlations within the data that might otherwise not be readily apparent, making them indispensable tools for data exploration. With Unacast, you can utilize our location insights platform for instant visualizations, or create your own using Tableau or other analytics platforms.
Location Intelligence and Unacast
Businesses curious about how these city foot traffic insights can transform their strategies and decision-making processes are invited to speak with a location data expert at Unacast today. Whether you're just beginning to explore the potential of location data or looking to deepen your existing analytics capabilities, Unacast offers a comprehensive suite of location intelligence solutions designed for businesses at every stage of the data analytics journey. Our team of experts is dedicated to helping you understand the nuances of foot traffic data and how it can be leveraged to drive business growth, enhance customer engagement, and optimize operational efficiency. Reach out to us today to learn how Unacast's location intelligence can empower your business to thrive in an ever-changing world.


