Foot traffic data refers to the measurement and analysis of the number of people moving into and out of a particular location over a given period of time. This information is commonly collected through various means such as cameras, sensors, and other forms of technology. The data is used by businesses, governments, and researchers to understand patterns of movement, assess the effectiveness of marketing campaigns, evaluate the popularity of certain locations, and for a variety of other purposes.
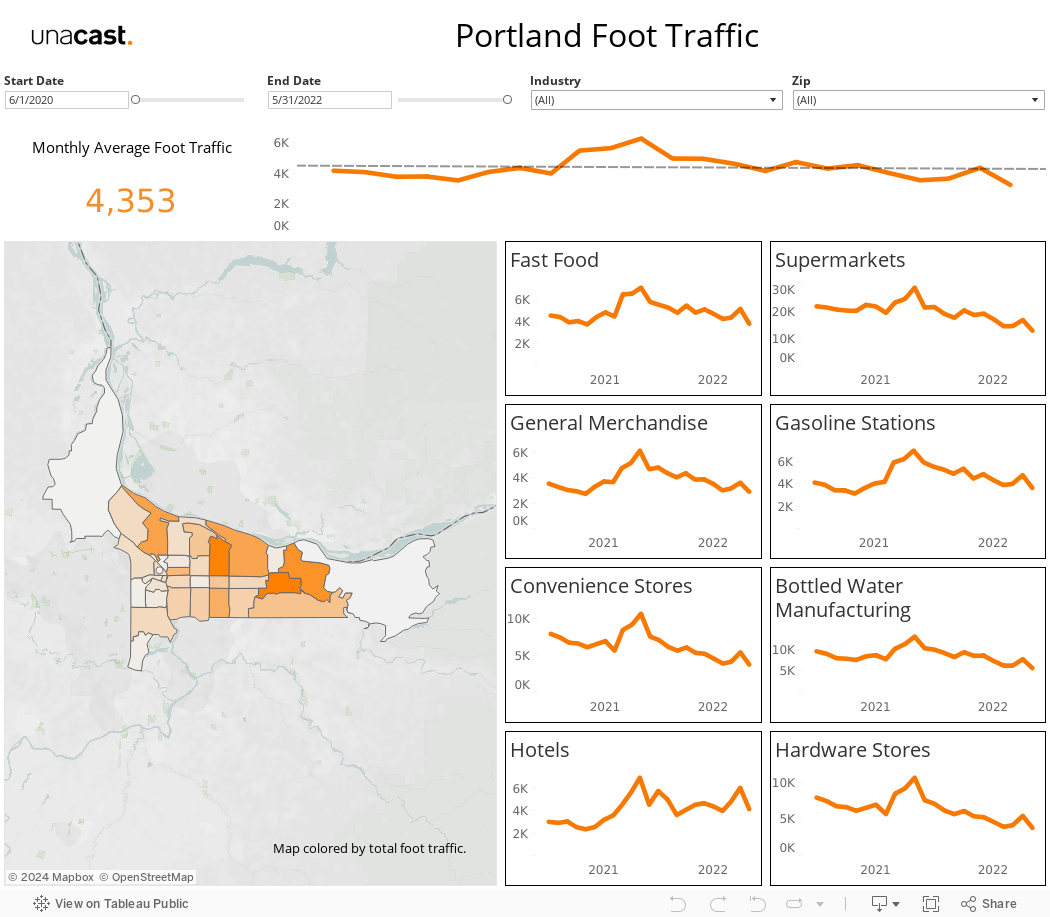
The average monthly foot traffic for Portland in the last 12 months was 4,244, this is a 5.1% decrease from the previous 12 months. Though foot traffic in Portland is decreasing overall, zip code 97030 has seen a steady increase. Gresham, Maywood Park and Troutdale neighborhoods experienced the highest total foot traffic for Portland. These 3 neighborhoods constitute over 28% of the total foot traffic experienced from 06/01-2020-05/31/022. Conversely, the Corbett, Southwest Hills, and Bachelor Island neighborhoods experienced the lowest total foot traffic for the same period of time.
Methodology – Portland foot traffic data was pulled from the Foot Traffic Trend Value module on a monthly basis. The metric Person Count was averaged by zip code by month and simple linear regression was applied to generate trend lines for Foot Traffic. When visualizing the data, the total foot traffic by zip code was plotted on a map and colored by total foot traffic. To analyze specific points of interest, data is aggregated at the Census Block Group geographic level. Additionally, Census Track level data can be used to investigate the surrounding area to any point(s) of interest.
Portland Foot Traffic Data Insights by Season
Portland saw the highest average monthly foot traffic (5,325) March 2021 through August 2021 with May 2022 having the lowest average foot traffic of 3,221 average visitors. May of 2021 had the highest total foot traffic (6,285) for the total time frame analyzed (06/01-2020-05/31/022). When considering only the past 12 months, the foot traffic pattern changes displaying little seasonality. Further analysis would provide insights into this change in visitor behavior.
Methodology - The metric Person Count was summed by zip code by month to generate Foot Traffic. To analyze change in foot traffic by quarter, Person Count was summed by zip code by quarter and the percent change was calculated between quarters.
Portland Foot Traffic Data Insights by Industry
Utilizing the North American Industry Classification System (NAICS) codes available in the foot traffic trend value module, consumers can gain valuable insights on 91 unique industry sectors found in Portland. The top industries include: Fast Food Restaurants, Supermarkets, General Merchandise Stores, Gasoline Stations, and Convenience Stores. While the industry specific foot traffic patterns generally mirror the overall foot traffic pattern of Portland, there is a notable difference in the hotel industry. While the foot traffic trend in Portland is decreasing, the hotel industry is experiencing an increase in average monthly foot traffic. Additionally, there was a larger than expected increase in foot traffic in the hotel industry in May 2021. Deeper analysis of foot traffic data for specific brands in the hotel industry could illuminate potential causes for this uptick.
Methodology – The NAICS codes were grouped to create broader Industry level classifications. The Person Count metric was then averaged by industry by month to calculate foot traffic. The data was then visualized for individual industries.
Need industry specific foot traffic data?
No problem! Get a custom foot traffic data sample curated for your exact use case.
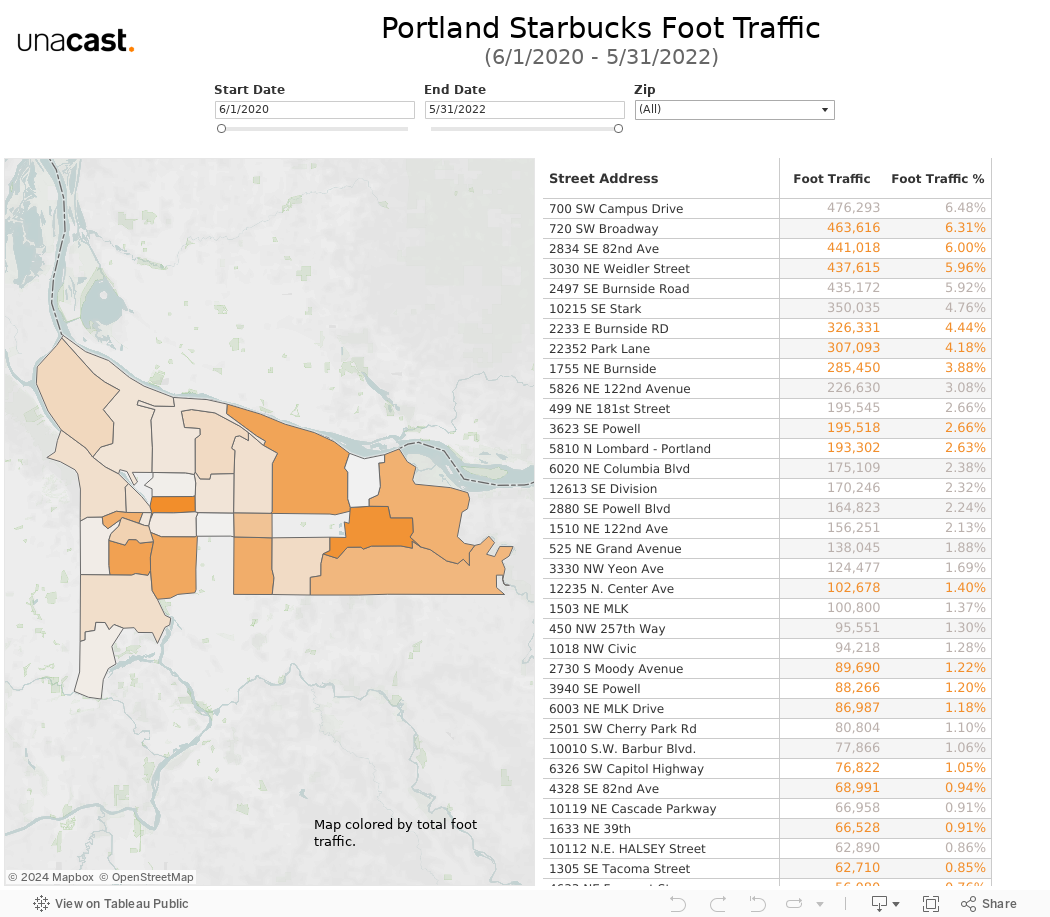
Foot Traffic data is available for 614 unique brands in Portland allowing consumers to create detailed brand analysis as well as head-to-head comparisons between two or more brands. The most highly trafficked brands in Portland include: Fred Meyer, Primo Water, McDonald’s, Starbucks, and Walmart.Taking a deeper dive into the foot traffic data available for the 61 Starbucks locations in Portland, we find that 48% or 29 locations are experiencing an increase in foot traffic. For the time period 06/01-2020-05/31/022, Gresham Butte has the highest average foot traffic pattern with 18,921 visits per month. The Kerns area had the highest total foot traffic for Portland Starbucks locations with 742,988 visits. This can be explained by the zip code 97232 being home to 4 Starbucks locations in total. While the total foot traffic at the 700 SW Campus Drive location is decreasing, it is the most visited Starbucks boasting approximately 6.48% of all Starbucks foot traffic in Portland. Conversely, the 155 N Tomahawk Island Dr location accounts for only 0.06% of the total Portland Starbucks foot traffic.
Methodology – The Portland data was filtered to only consider the brand Starbucks. The metric Person Count was summed by zip code by month to calculate Foot Traffic. To analyze change in Foot Traffic by quarter, Person Count was summed by zip code by quarter and the percent change was calculated between quarters. For location level data, Person Count was summed by Street Address. Foot Traffic Percentage was calculated by taking the sum of foot traffic for street address and dividing the resulting value by the total Foot Traffic for Portland in the selected date range.
Get foot traffic data on-demand!
Unacast's foot traffic data is trusted by best-in-class organizations worldwide. Click the button below to get connected with one of our data experts!