Foot Traffic Data

Analyze real-world visitation anywhere in the world with Unacast Location Intelligence, available as on-demand APIs or as a data feed, so your team can build the foot traffic analysis your business actually needs.

Book a Meeting
Pedestrians crossing a busy city street at sunsetPedestrians crossing a busy city street at sunset

How Customers Use Location Intelligence for Foot Traffic

Unacast Location Intelligence delivers area-level visitation data straight into your own models, platforms, and workflows, so you can answer where people go, when, and how often on your own terms.
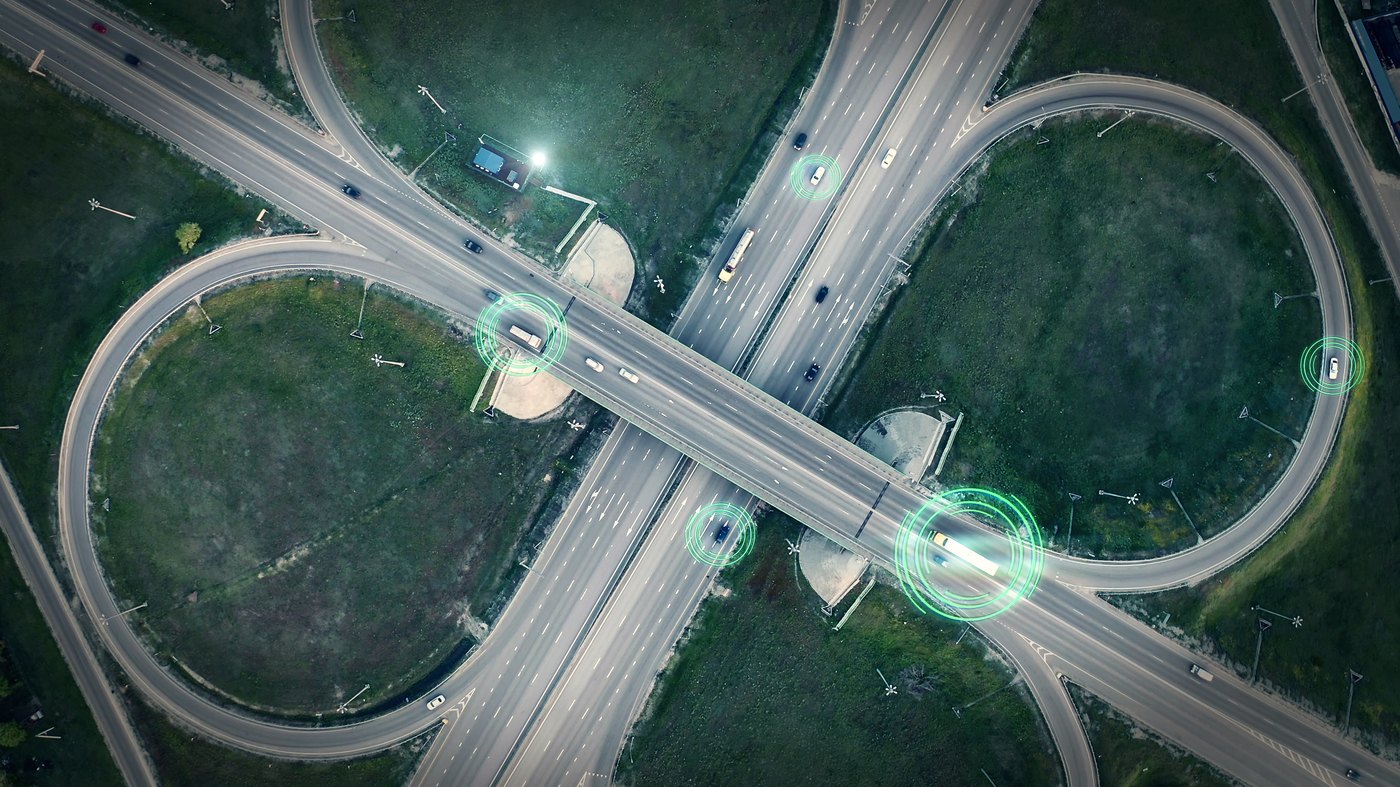
Aerial view of a highway interchange

Understand Area Trends

See how visitation to an area changes on an hourly, daily, weekly, and monthly basis. Use the Area Visitors trends endpoint to track movement across commercial places of interest, and Trade Areas to understand where those visitors travel from.

Explore Area Visitor Trends

Aerial view of a city street intersection

Smarter Site Selection

Evaluate how a prospective location is likely to perform before you commit. Query Area Visitors across candidate areas to compare visitation volume and trends, then layer Trade Areas to see which sites draw higher-income or more family-oriented populations.

Evaluate Your Next Location
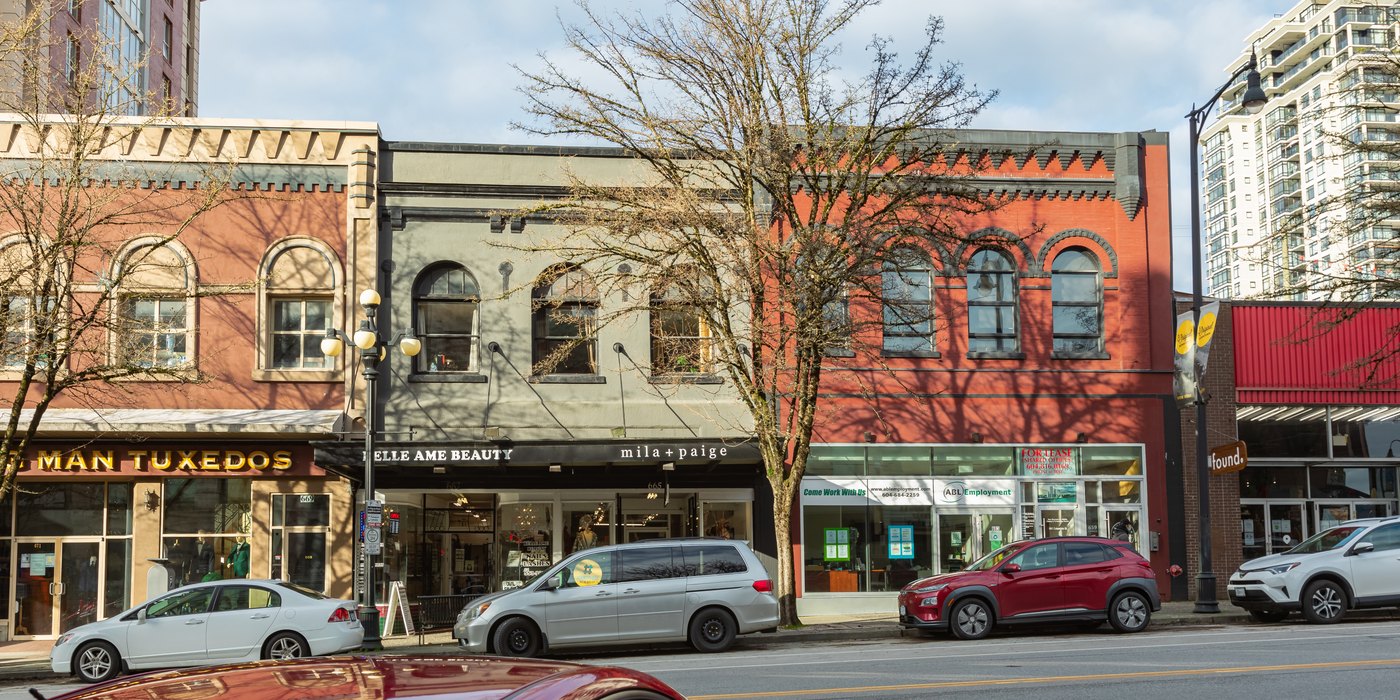
Storefronts along a city main street

Competitive Intelligence

Apply custom geofences to any set of locations — yours and your competitors' — and compare visitation patterns across all of them using the same polygon, time range, and forensic filters.

Map Your Competitive Landscape

Shopper browsing clothing in a retail store

Identity Resolution & Audience Targeting

Retrieve mobile advertising IDs and combine them with Unacast data linkages to build identity graphs or power audience-based targeting. Personas adds behavioral segments, so you can understand the types of people visiting an area and activate against them.

Activate Behavioral Segments


Four APIs for Location Intelligence

Location Intelligence is made up of four analytics APIs, applicable to locations of interest across the globe. Each takes a polygonal geofence, a time range, and the forensic flags you choose to apply.

Overhead view of pedestrians with detection boxes
Area Visitors

Who and How Many

Quantify visitation to any custom area over time. Submit a polygon and a date range, get back unique device counts and visitation trends. Use the trends endpoint to surface spikes by day of week, holiday, or campaign period.

City skyline overlaid with a connected network graphic
Observations

Behavior Within the Area

On-demand access to our global Observations dataset. Timestamped, coordinate-level signals with device type and forensic flags, so your team can filter by signal behavior and model longer-window patterns and seasonality.

Aerial view of a road network with data connections
Trade Areas

Where Visitors Come From

Uncover the origin ZIP codes and census block groups of your visitors, returned with demographic context including total population, median income, and full geographic hierarchy. Compare sites to see which locations draw which audiences.

Crowd of pedestrians on a city street in autumn
Personas

Behavioral Segmentation

Understand who visits an area. Returns the dominant persona segments for your polygon across behavioral attributes (in-market behavior, lifestyle, interest group, brand affinity, visit frequency), demographics and life stage, geography, device type, and B2B segment.

Two Ways to Access the Data

Aerial view of a highway junction with network overlay

Location Intelligence APIs

On-demand access to Area Visitors, Observations, Trade Areas, and Personas. Submit a geofence and a time range, get results back in the moment.

Best for teams building their own analysis, tooling, or client-facing platforms.
Book a Meeting
Aerial view of a highway junction with network overlay

Location Intelligence DaaS

The same four datasets delivered as a recurring feed into your own environment. Define your areas of interest once and receive refreshed visitation data on your schedule.

Best for teams loading location data into a warehouse, lakehouse, or existing data pipeline.
Book a Meeting

Frequently Asked Questions

Whether you’re looking to understand real-world consumer behavior or improve your marketing strategies, find answers to your most common questions and effectively leverage Unacast’s location data.

What is foot traffic analysis?

Foot traffic is a key metric when it comes to understanding how people interact with physical spaces. It can show how busy a location gets, when peak hours occur, and how visitor patterns change over time. This insight is critical for things like planning a store layout, evaluating marketing campaigns, or deciding how to staff different locations.

How do you analyze foot traffic data?

Foot traffic data goes beyond just counting visits. It looks at how long people stay, how often they return, and where they go next. With the right tools, companies can use this data to fine-tune their operations, improve the customer experience, and ultimately boost performance.

Can I measure visits to my own stores?

Yes. Apply a custom geofence to your own locations and query Area Visitors for visitation counts and trends over any time range. Because every query uses the same polygon, time range, and forensic filters, you can compare your stores against each other, and against competitor locations, on a like-for-like basis.

Why is foot traffic important?

Foot traffic indicates real-world customer engagement and potential sales opportunities. Understanding it helps businesses make better decisions about location strategy, evaluate campaign performance, and stay competitive in dynamic markets.

Book a Meeting

Meet with us and put Unacast’s data to the test.
bird's eye view of the city