Our Data

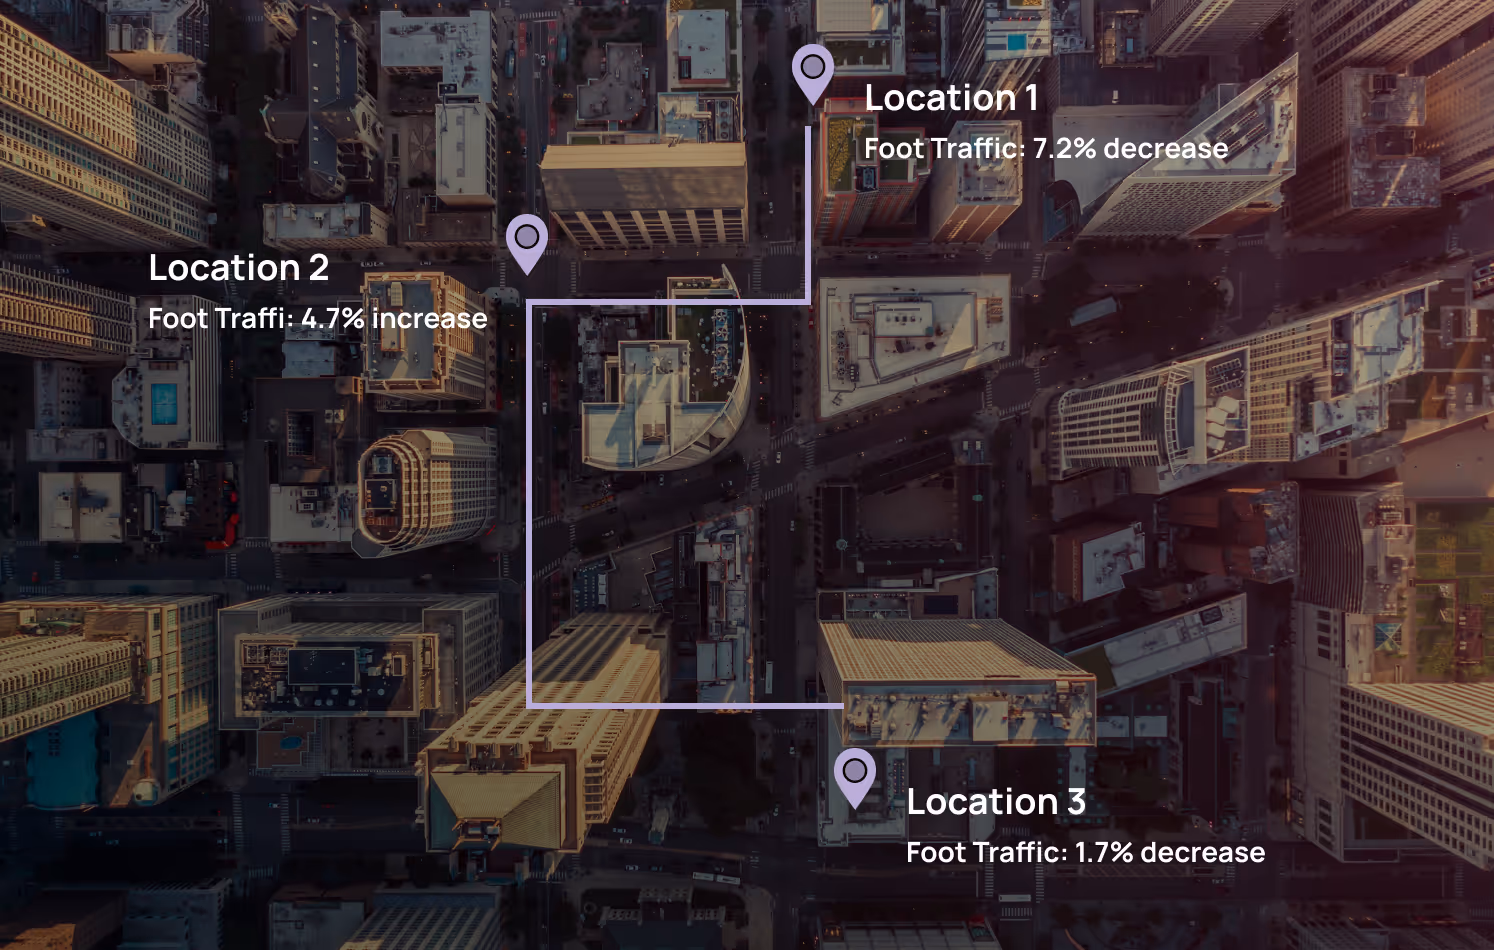
Validate your next business decision with our machine learning-powered human mobility insights.

Book a meetingTry our data
A 3d visualization of migration patterns map
 

Trusted by

BCG logo
Bloomberg logo BLACK
Carto logo
Esri logo
Google logo
Precisely logo
Spacewise logo
southern crown logo

Building blocks for our datasets

We provide foot traffic, trade areas, cross visitation, and migration pattern data to help you solve your biggest business problems.

A 3D visualization of foot traffic map

Understand visits in and around a location over time

Our Foot Traffic Dataset helps you understand the visitation at a specific site or area – how many people visit, types of visitors, and traits of the visit (when they visit, how long they stay, and how often they return).

  • Number of people visiting a location
  • Time people spend at a location
  • Capture rate (how many people were in close proximity of your store vs. people who actually visited a store)
  • Customer loyalty (do customers return every month)
A 3D visualization of the Trade Area

Understand your key trade areas

Make better decisions by understanding home and work locations of your visitors.

  • Changes to your trade areas over time
  • Distance your customers travel to your location
  • Where your customers live and work
Products Shopper Journey: A 3D map showing a shopper's journey through lines between businesses

Understand what other venues customers visit

Identify what shops your customers also visit to learn about their shopping preferences.

  • Identify other locations your customers visit
  • Understand patterns in the locations customers visit
  • Find cross-merchandising opportunities by knowing which other shops your customers visit
Our Process

How we build our datasets

Our datasets are built with a privacy-first mindset to give you peace of mind as you solve your biggest business problems.
Step 1

Gather multiple data sources

We gather data sources like GPS location data (from 130M+ smartphones and mobile apps), weather, demographics, industry trends, venue attributes, historical data, and more.

After cleaning, correcting, and preprocessing, these data sources serve as features we feed into our industry unique machine learning model.

Using multiple data sources allows us to build a more robust and reliable understanding of mobility that is less dependent on GPS data fluctuations and quality because it is based on a magnitude of different context.

Read More

Thicc arrown down
Step 2

Build machine learning models

From the multiple data sources, we create a feature library that allows us to build our machine learning models that find relationships between different data sources and our target mobility insights.

Each machine learning algorithm is selected and we train our models on a training dataset to optimize its performance. Thereafter the trained model is evaluated on a validation set for its performance. We address any issues and improvements to the model before putting it in production. Once deployed in production, it runs on new data as it becomes available to calculate mobility insights.

Read More

Thicc arrown down
Step 3

Create curated datasets

We have datasets depending on your data maturity and needs: Foot Traffic, Dynamic Trade Areas, Cross Visitation, and Migration Patterns.

A common issue using ML models is that those always give you a prediction without understanding if that is right or wrong. When validated against ground truth data, Unacast’s models recorded an R-Squared of 91.6% or higher, widely considered to be best-in-class.

Read More

Thicc arrown down

Book a Meeting

Meet with us and put Unacast’s data to the test.
map illustrationmap illustration

Resources