


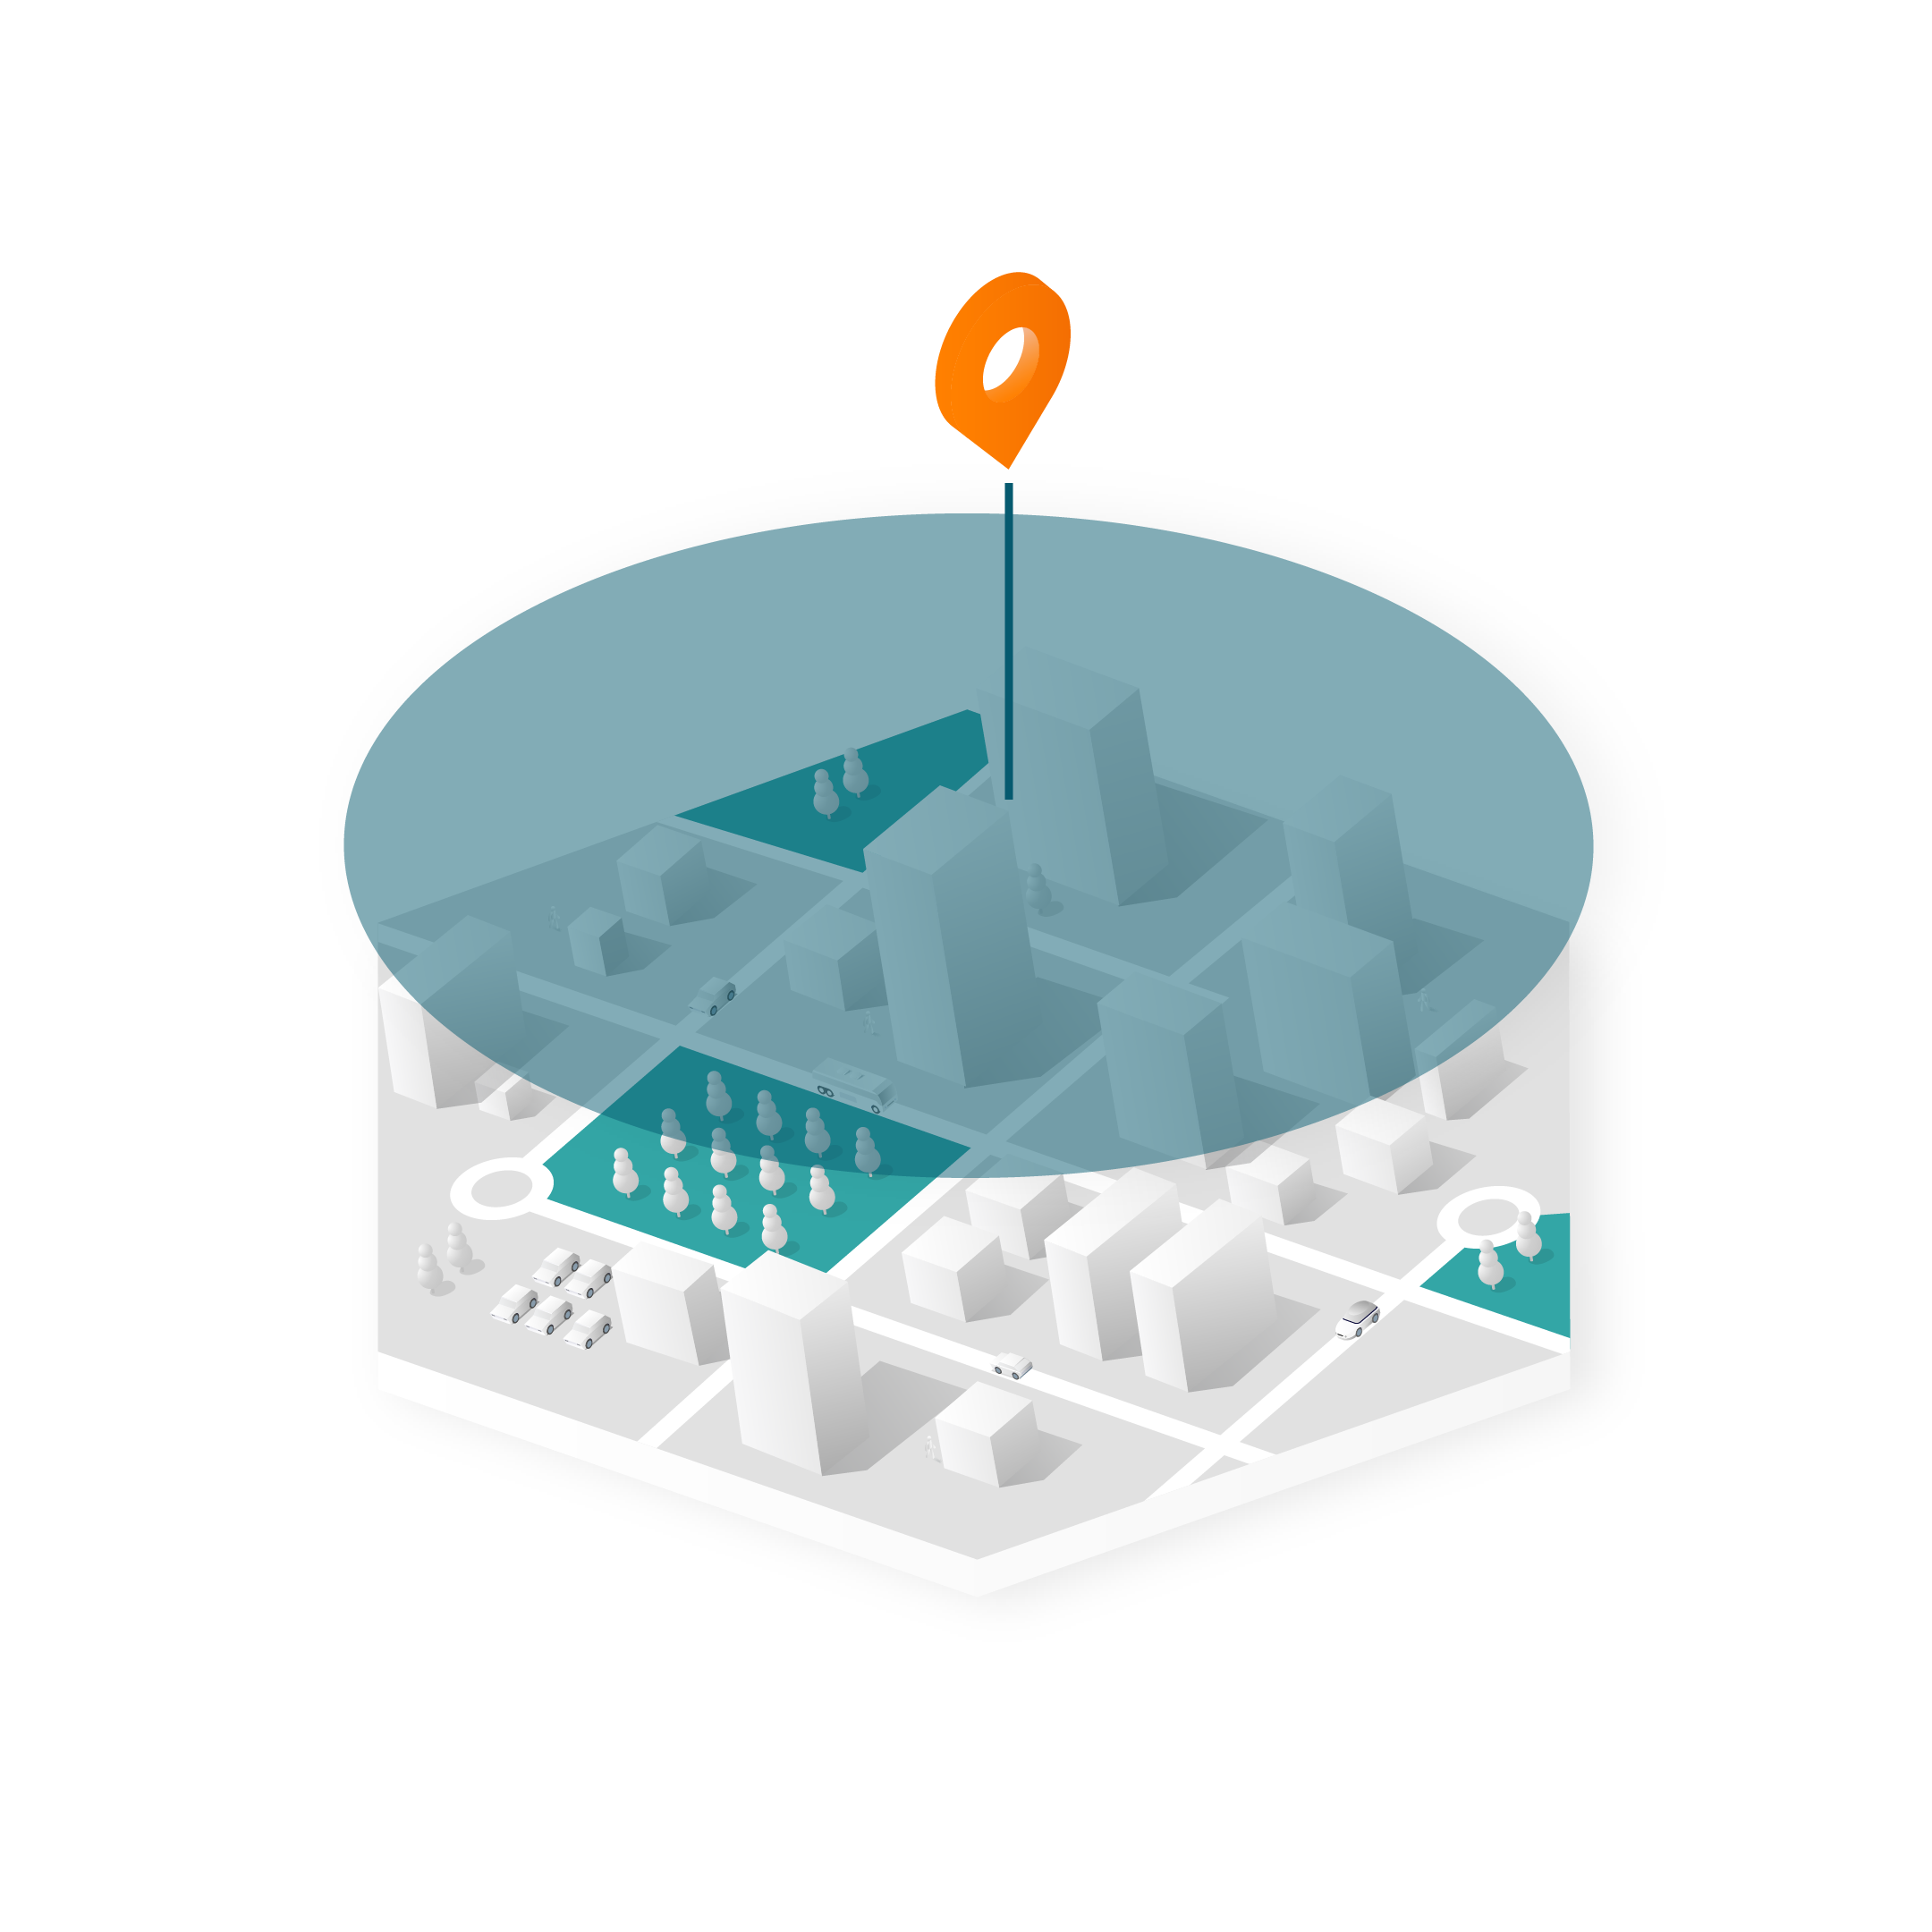
Geospatial data is used across industries to help inform new insights about how people and things move around the world. Often blended with data from other verticals — including finance, real estate, retail, insurance and healthcare — geospatial data analysis is a growing area of enterprise interest and investment.
In this post, we'll address the following:
- What is geospatial data?
- The benefits of geospatial data analytics
- How to use geospatial data
- Visualizing geospatial data
- Processing geospatial data
- Four types of geospatial data analytics
- An example of geospatial data analytics
- Frequently asked questions about geospatial data
To begin our exploration, let’s start by defining geospatial data and examining how it is used in everyday practice by both the public and private sector.
What is geospatial data?
Geospatial data provides insight into a specific location at a specific time.
According to Automating Open Source Intelligence, “Geospatial data is data about objects, events, or phenomena that have a location on the surface of the earth. The location may be static in the short-term (e.g., an earthquake event), or dynamic (e.g., a moving pedestrian or the spread of an infectious disease). Geospatial data combines location information, attribute information, and temporal information (the time or life span at which the location and attributes exist).”
Put another way, geospatial data provides the where and when of human mobility. But when combined with other data and analyzed, the answers to why we move the way we do can also be unlocked.
In the public sector, this data is often used to address long-term projects involving new cities, neighborhoods, and critical infrastructure. University researchers, civil engineers, and sustainability experts value geospatial data for its ability to inform decisions. It also helps them measure the effects of both planned and event-based changes in mobility (e.g. a catastrophic weather event).
Geospatial analysis is used in the private sector for investment, site selection, competitive intelligence, and demand forecasting. Global enterprises, software companies, and consultants often use geospatial data analytics. Telcos and other companies with large amounts of geospatial data can use third-party platforms to monetize their data.
The benefits of geospatial data analytics
Good geospatial data is rich in both a time and spatial sense. Geospatial data requires accuracy and an ample amount of data to measure exactly where a person is and when they are there. From this, a series of ‘pings’ are generated that can tell a geospatial data analyst a great deal, including extrapolations to the population level. Some of the benefits of working with geospatial data include:
- Identifying mobility patterns and trends. Get a high level understanding of how people are moving through a defined region over a period of time.
- Improving visitor profiling. With demographic data, you can begin to create a more nuanced picture of customers and understand movement between different venues and brands.
- Informing decisions. The most common geospatial data use case is to inform a decision, very often an investment decision. The bigger the investment to be made, the more information (data) needed.
There are two variations on this geospatial data use case:
- Identifying areas of interest. For example, a retail brand is seeking an optimal location for a new store. In these instances, the use case is to apply geospatial data analytics from different venues to assess potential store locations.
- Comparing sets of areas. For example, a commercial real estate investor wishes to evaluate different multifamily residential development opportunities. The CRE may dig-in around migration patterns indicators.
In both data analysis use cases, the ultimate driver is using geospatial data to make an informed investment decision.
How to use geospatial data
Geospatial data and geospatial analysis are applied across industries and use cases. Some of the more common applications include informing site selection, generating competitive intelligence, and demand forecasting in the supply chain.
Site Selection
Site selection is a critical process for many organizations. Site selection involves evaluating what markets to enter or exit, where to build or close stores, and which new locations to prioritize. Leading organizations utilize geospatial data analytics in order to:
- Discover areas that residents and/or visitors already congregate or travel to
- Discover which site characteristics help create a lasting visitor base
- Pinpoint which sites meet your ideal visitor mix
- Identify which areas have gaps in the local marketplace
- Evaluate the foot traffic/performance of a potential site
- Forecast capture rates for new sites
Competitive Intelligence
Leading organizations leverage geospatial data analysis to uncover new trends about their competitive landscape. This allows them to build better products and make smarter decisions using real-world data.
- Measure market share and regional dominance over time
- Benchmark locations’ against competitors’ sites or total addressable market
- Understand consumer behavior with competitors’ sites
- Learn where, when, and how often customers visit your location vs. your competitors’
- Compare your visitor demographics to your competitors’
- Discover common characteristics of your competitors’ locations
Demand Forecasting
Global companies leverage geospatial data analytics to gain a deeper understanding of supply chain, logistics, distribution, and demand forecasting.
- Measure consumer activity at precise locations to optimize supply chain planning
- Explore changes in area demographic profiles that impact sales
- Understand site potential using venue-specific foot traffic as a proxy
- Plan for opening, closing, or growing of sites and market areas
- Enhance site analysis with capture rate, visit duration, customer origin
- Unlock trends for any area using custom-defined locations
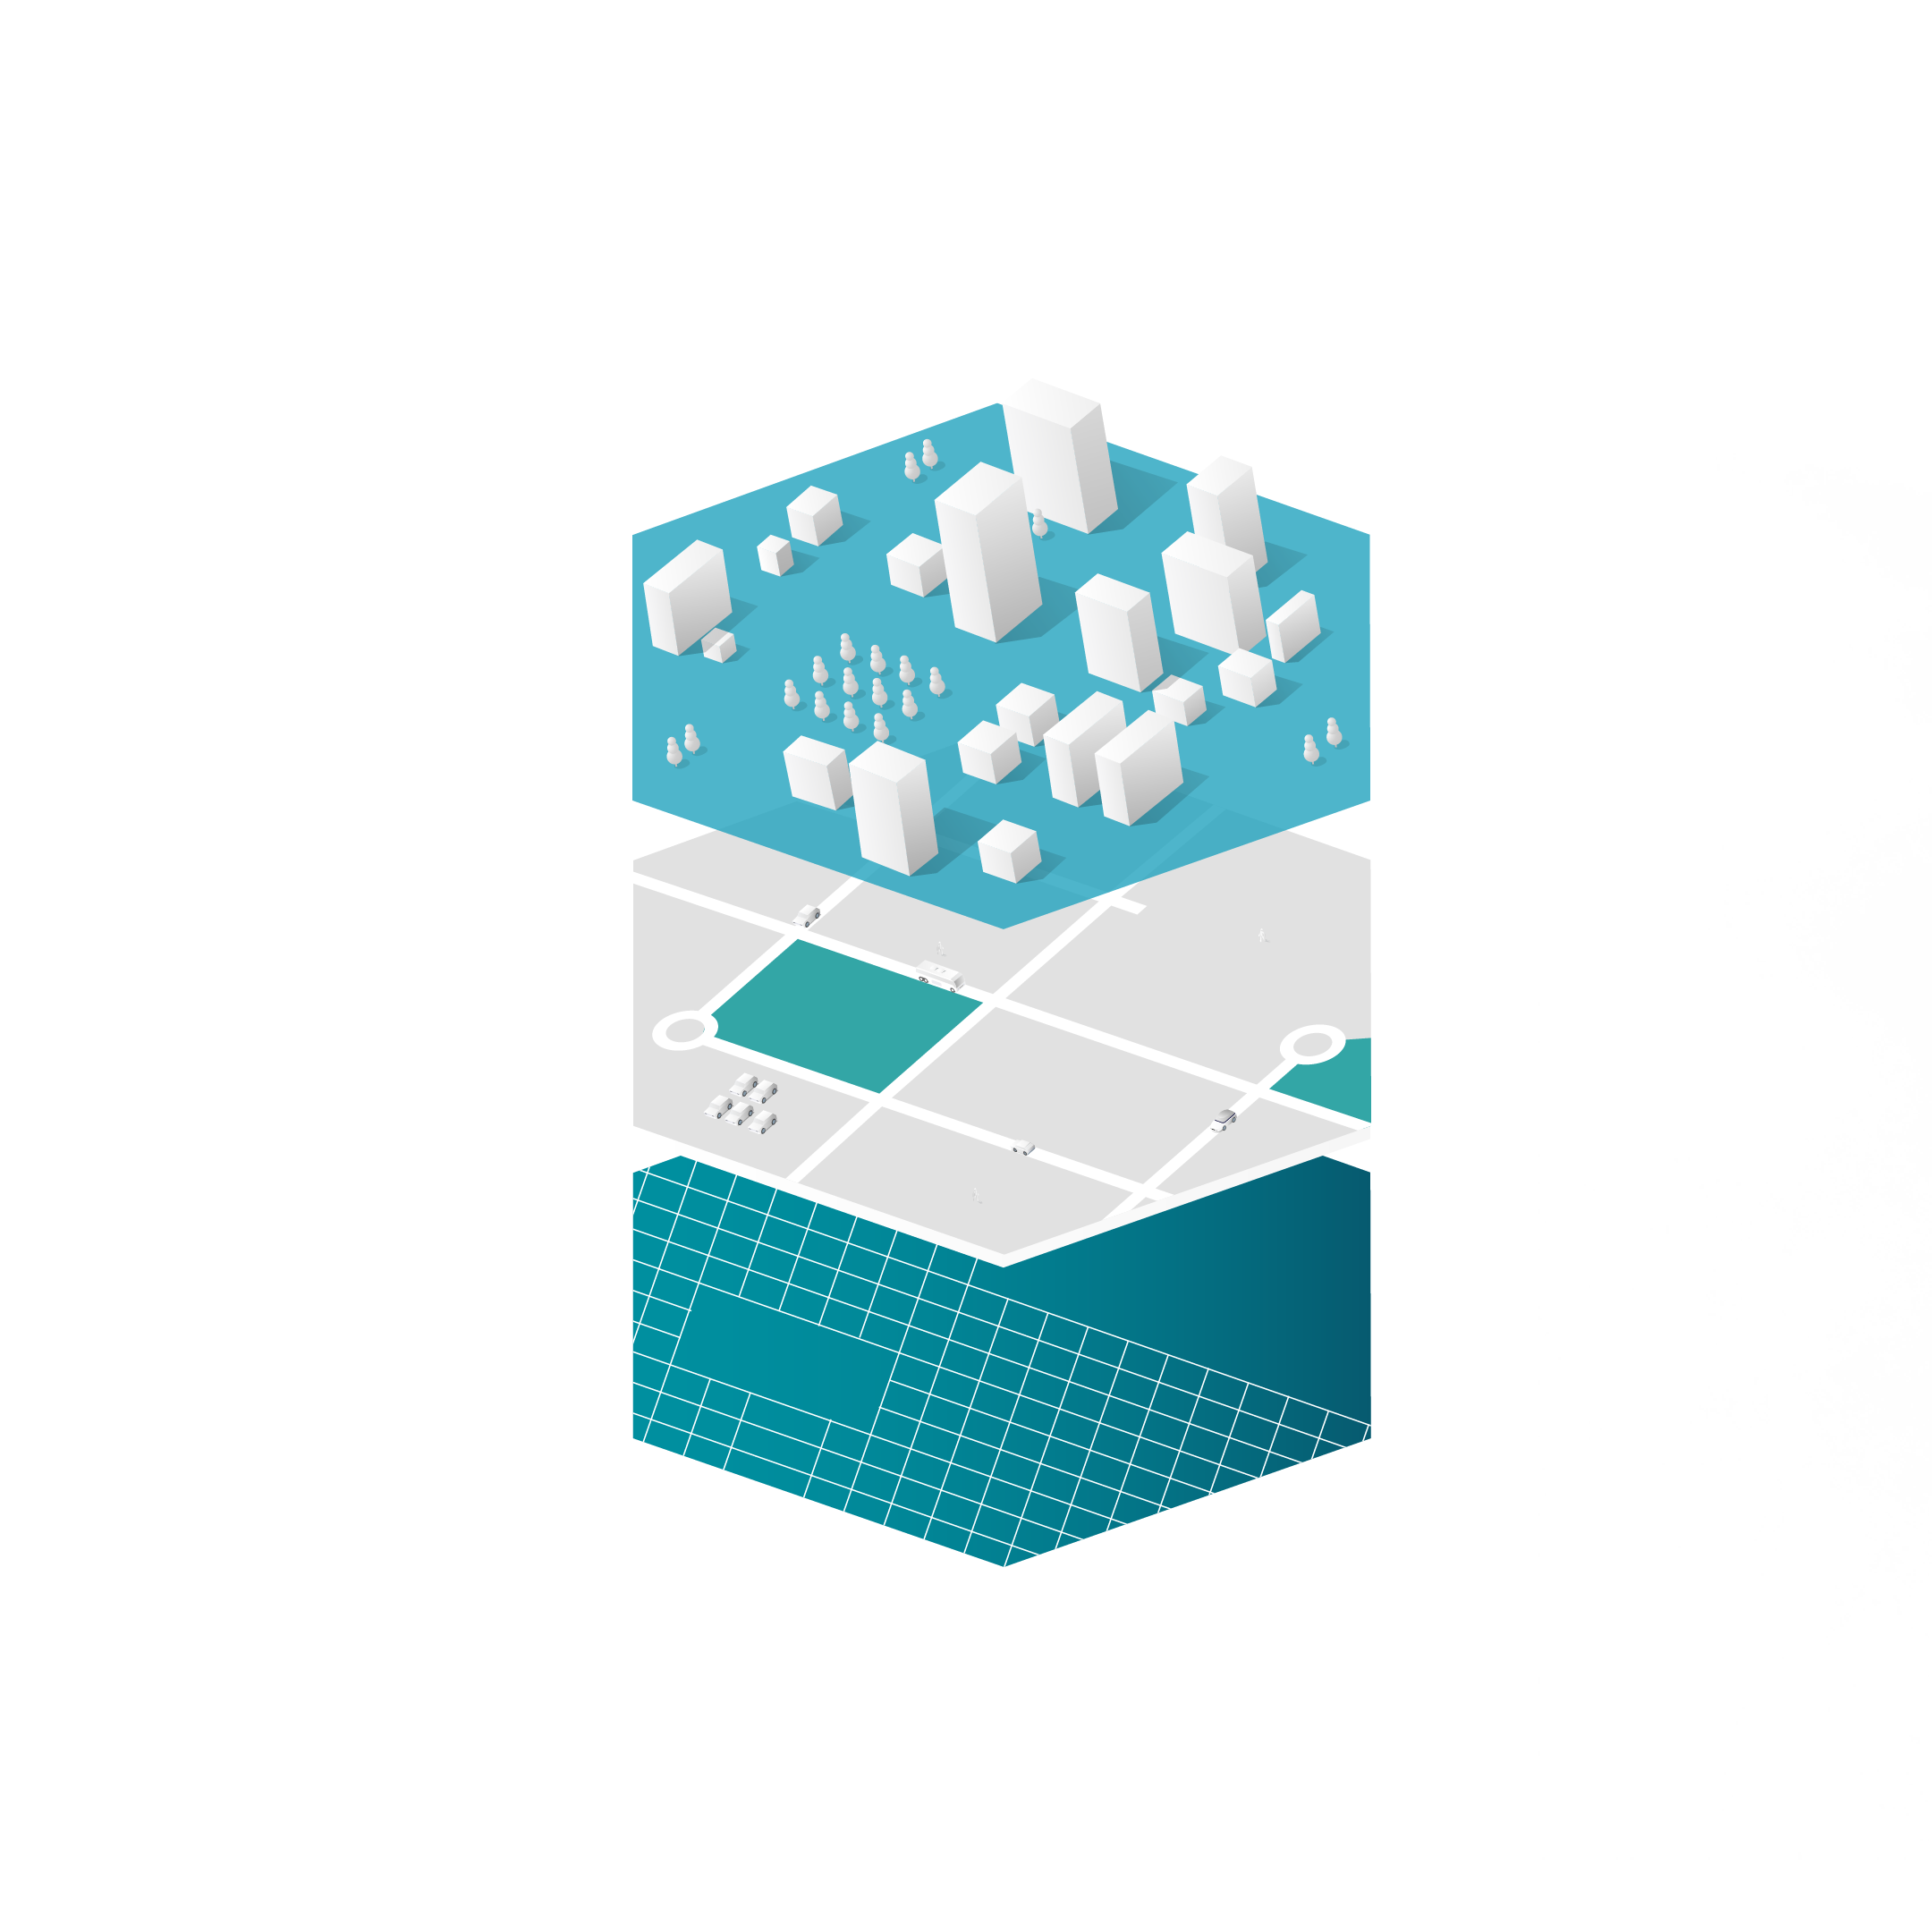
Visualizing geospatial data
The key to unlocking the potential of geospatial data analytics is visualization. Each data point and metric can be laid out in such a way that it is immediately revealing and meaningful. There are many tools available to visualize geospatial data. Some of the easiest to use and most popular are Tableau, Jupyter and Carto.
- Tableau is an excellent tool for creating simple, map and chart-based visuals of geospatial data. By running a basic query on Unacast Now and feeding that data into Tableau, we were able to create a collection of useful data visualizations with both map-level and core metric data.
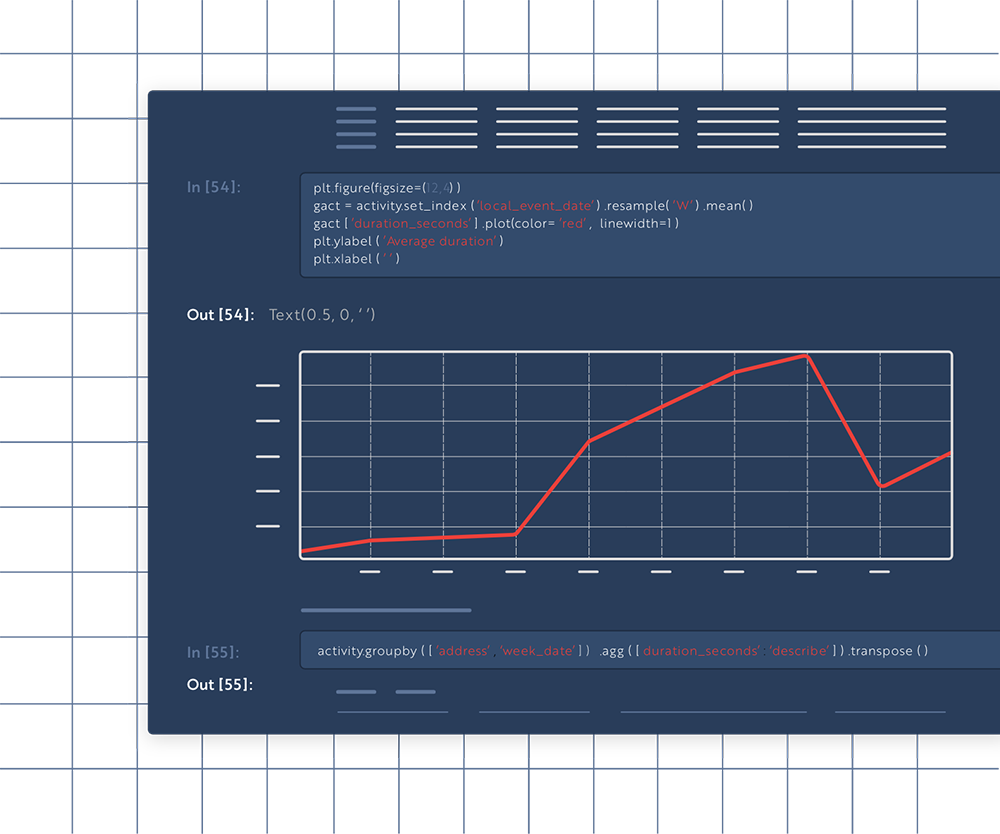
- Jupyter has a flexible interface that allows users to configure and arrange workflows in data science, scientific computing, computational journalism, and machine learning. A modular design invites extensions to expand and enrich functionality and pull the most out of geospatial data. Check out our data scientist worthy example of a Jupyter notebook for Site Selection.
- CARTO's Location Intelligence platform allows organizations to store, enrich, analyze, and visualize their data to make better decisions. Whether it's optimizing billboard sites, balancing sales territories, or designing supply chains, understanding and analyzing geospatial data is critical to the future of your business. Carto and Unacast are partners with joint solutions in the market.

Processing geospatial data
Leading telcos and global organizations rely on Unacast’s geospatial data processing platform, Turbine, to turn raw geospatial data into valuable human mobility insights. With the Turbine PaaS, you can:
- Measure human activity and journeys. By configuring map layers to meet your specific needs, you can determine home and work locations, visitor origins, and destinations as well as the waypoints in between.
- Keep your data in-house. Extract value from your geospatial data sets without having to release it into an unrestricted environment. Unacast’s safeguards keep your data safe and prevent potential violations of privacy regulations.
- Innovate faster than ever in the cloud. Accelerate beyond your internal capabilities and quickly iterate on new functionality. At the same time, manage complex factors like extrapolation, composition, noise, and identity screening — all in a safe cloud environment controlled by you.
- Inclusive and agnostic data sources. By unlocking previously unusable geospatial data, our solution has already been shown to improve energy efficiency by 30% while boosting revenue by over 50% for Smart City Product & Services Providers.
Cheap and risk free, Unacast can build a Proof of Concept for your telco based on your data and process. We'll deliver a product and measure results all in about 3 months. Schedule a meeting to learn more.
Four types of geospatial data analytics
Let’s zero-in on four types of geospatial data analysis that span across industries. You can utilize foot traffic data, migration patterns, trade area analysis, and cross-visitation data.
Analyzing Foot Traffic
Geospatial data analytics are often discussed in terms of foot traffic data measuring a specific site or area. How many people visit, the type of visitor, and traits of the visit (when people visit, how long they stay and how often they return). This is of particular interest when assessing commercial real estate and retail performance.
Exploring Trade Areas
Geospatial data analytics can also measure what is happening in a trade area. A trade area is composed of all the home areas of visitors to the place. It defines where visitors live and how far they are likely to travel to a particular place. This is valuable for measuring customer loyalty with insights into evolving visitor patterns.
Understanding Cross-Visitation Trends
Identify what other stores your customer also visits to learn about shopping preferences through cross-visitation data. Understand other locations or brands your customers visit and how these buying preferences change with time. Add new products or create cross-merchandising opportunities by building relationships with retailers who share your target audience.
Understanding Migration Patterns
Geospatial data powers an understanding of migration patterns. These are insights that real estate investors and others use to identify potential commercial hubs and areas of growth, assess service availability, and identify areas with depleting populations.
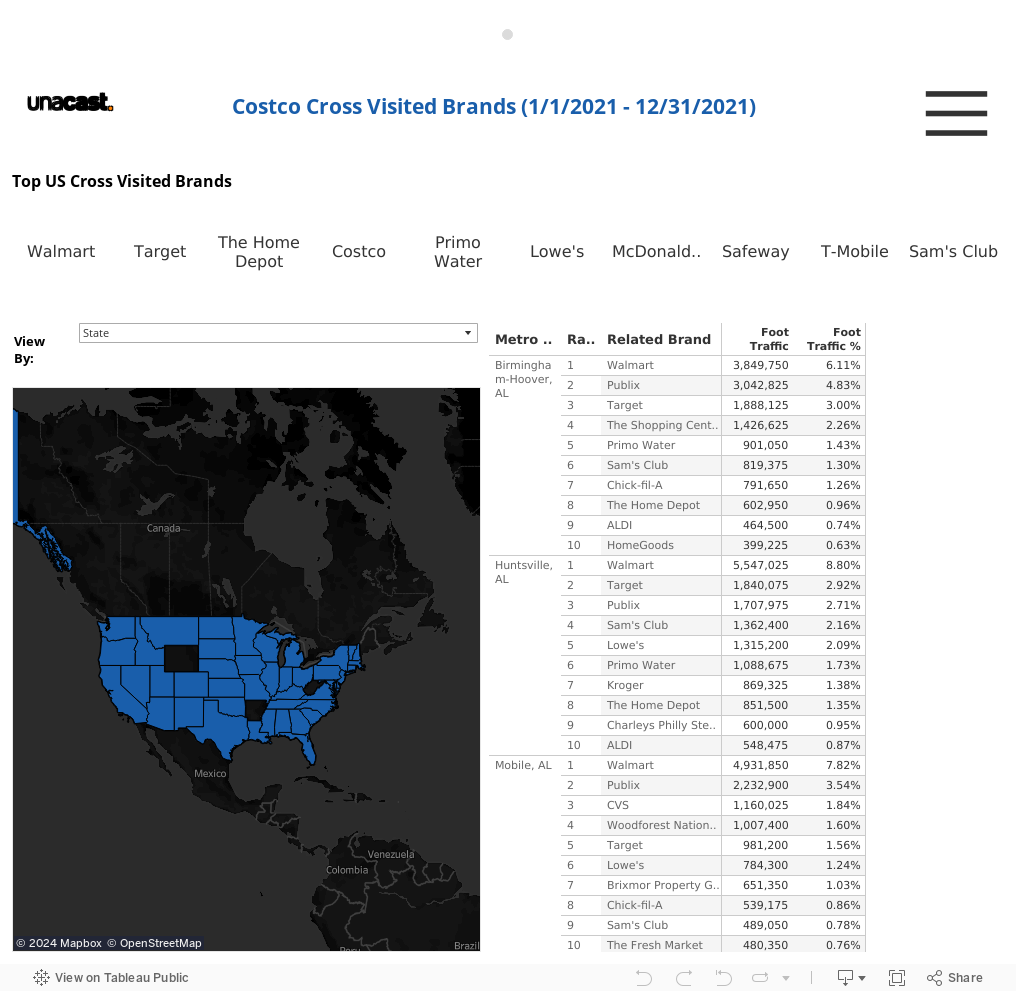
An example of geospatial data analytics
Explore cross-visitation data for Costco and see which other brands are visited most by Costco shoppers. To learn more and see an example with your own data, schedule a meeting with a data expert.
Frequently asked questions about geospatial data
What is geospatial data analysis?
Geospatial analysis is the gathering, analyzing, managing, and visualizing data with a geographic component. This can be GPS data, satellite photography, historical data with latitude, longitude, or any other spatial reference. It's used for gaining insights into locations, making decisions, and supporting problem solving in areas like urban planning, national security, environment, and transportation. It combines techniques from geography, computer science, and statistics to process, analyze and interpret geographical data.
Is GIS the same as geospatial data?
GIS (Geographic Information System) and geospatial data are related but not the same thing. Geospatial data refers to any data that has a geographic or spatial aspect, such as latitude, longitude, or any other type of geographic reference. GIS, on the other hand, is a tool used for working with and analyzing geospatial data. It is a computer system that is designed to store, analyze, and visualize geospatial data. GIS includes hardware, software, and data that are used to create maps, perform spatial analysis, and solve geographic problems.
What are the 3 types of geospatial data?
Raster Data: This represents spatial information in a grid format, where each cell of the grid represents a specific attribute or value. It can incorporate high-resolution images taken from above. Raster data is used to represent continuous phenomena, such as elevation, land use, or temperature.
Vector Data: This represents the descriptive information about location as points, lines, and polygon features. It is used to represent discrete or categorical phenomena, such as roads, political boundaries, or land ownership.
Point Data: This represents geographic information as a set of individual points, each with a specific location and attributes. This collection of co-located points can be turned into 3D models and is used to represent discrete phenomena that can be represented by a single point, such as a tree, a well, or a building.
Is geospatial data qualitative or quantitative?
Geospatial data can be both qualitative and quantitative.
Geospatial data is quantitative because it is numerical and can be measured, including data points such as elevation, population density, or temperature. This type of data can be analyzed using mathematical and statistical methods.
Qualitative geospatial data is descriptive and categorical, such as land use, political boundaries, or cultural features. This type of data can be analyzed using things like spatial pattern recognition, spatial clustering, or spatial classification.
In practice, most geospatial data sets include a mix of both qualitative and quantitative attributes.


